
Figure 4.
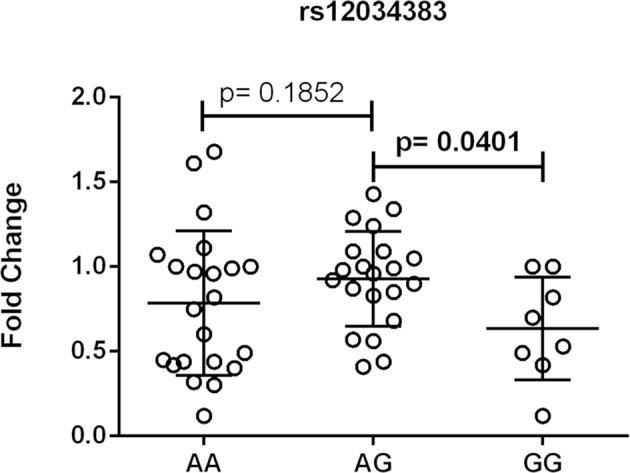
Association between the expression of CR1 mRNA and CR1 rs12034383 polymorphism. Fold-change values were calculated through the 2–ΔΔCt method. The horizontal bars in the clusters indicate the median. P-values indicate a statistical significance at the 0.05 level and were calculated by Mann–Whitney's test. Scatter plots were constructed from the raw non-normalized, fold change data using GraphPad 6.0 software (La Jolla, California, USA).