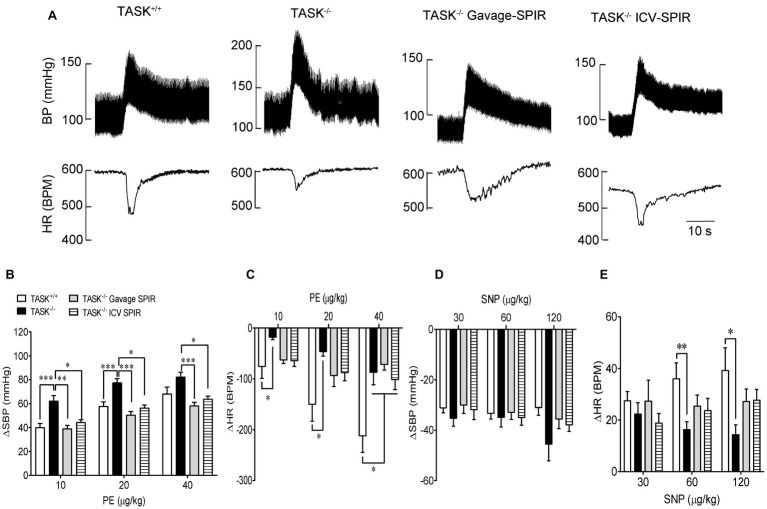
Figure 6.
Baroreceptor reflex function. The baroreflex function was measured pharmacologically in anesthetized TASK+/+ and TASK−/− mice. (A) Typical traces showing responses of BP and HR to intravenous injection of PE. (B,C) The mean change in SBP (ΔSBP) and HR (ΔHR) in response to intravenous injection of PE. Statistical analysis reported significant effects of dose and genotype as indicated by asterisks. n = 18 mice/48 responses for TASK+/+, n = 12 mice/31 responses for TASK−/−, n = 10 mice/30 responses for TASK−/− with gavage of SPIR, n = 12 mice/36 responses for TASK−/− with ICV injection of SPIR. (D,E) The mean change in SBP pressure (ΔSBP) and HR (ΔHR) in response to intravenous injection of SNP. n = 18 mice/41 responses for TASK+/+, n = 12 mice/34 responses for TASK−/−, n = 10 mice/30 responses for TASK−/− with gavage of SPIR, n = 12 mice/33 responses for TASK−/− with ICV injection of SPIR. *p < 0.05, **p < 0.01, ***p < 0.001 as indicated, one-way ANOVA with Tukey’s multiple comparisons test. PE, phenylephrine; SNP, sodium nitroprusside.

