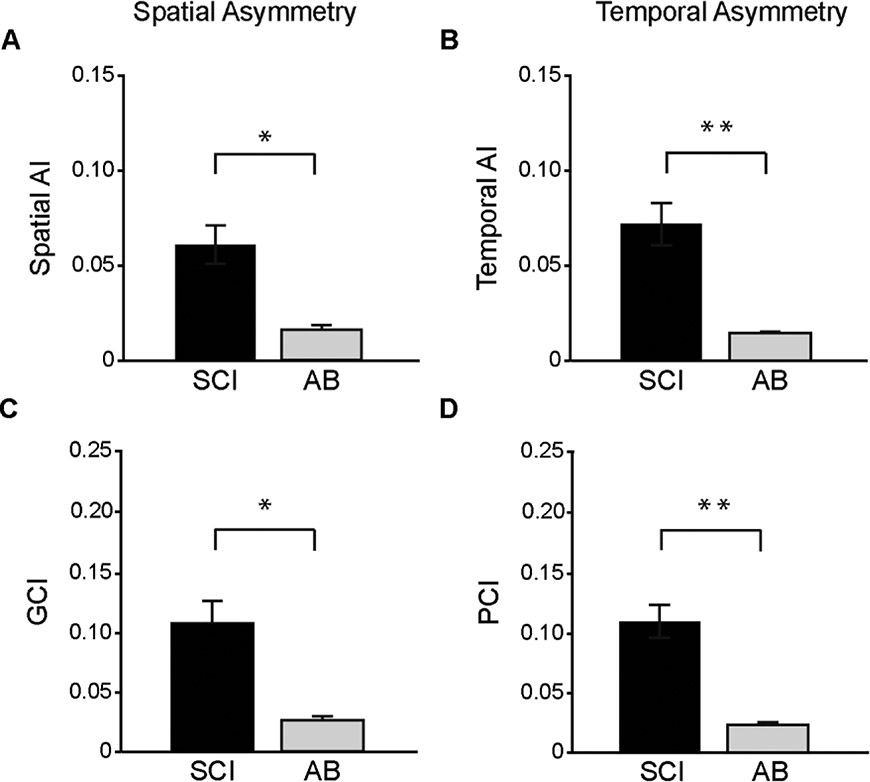
Figure 2.
Comparison of the spatial and temporal asymmetry indices of the iSCI and AB groups. Each bar graph represents the group mean (±1 SE) of each asymmetry index. Black bars for the iSCI group and light grey bars for the AB control group. Panels in the left column (A, C) depict spatial asymmetry indices while the right column panels (B, D) show temporal asymmetry indices. A: Spatial asymmetry index. B: Temporal asymmetry index. C: Gap coordination index. D: Phase coordination index. * indicates p=0.001. **indicates p<0.001

