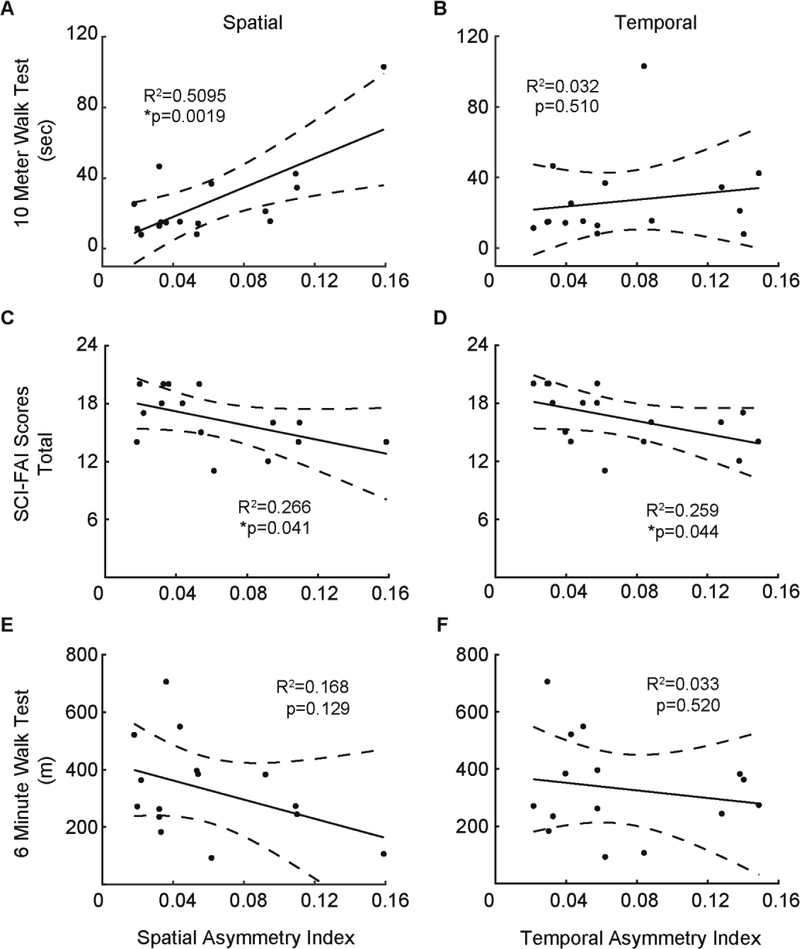
Figure 3.
Relationship between spatial and temporal asymmetry indices of the iSCI group. Lines within each panel indicate linear regression and dashed lines delineate 95% confidence interval. Each marker represents one subject. A: spatial asymmetry index vs temporal asymmetry index. B: Gap coordination interval (GCI) versus phase coordination interval (PCI). GCI and PCI are quantified to reflect the global asymmetry as well as the step-to-step variability of this asymmetry. C: Coefficient of variation (CV) of the gap interval (spatial) versus coefficient of variation of the phase interval (temporal). Only the relationship between spatial and temporal CV was significant.

