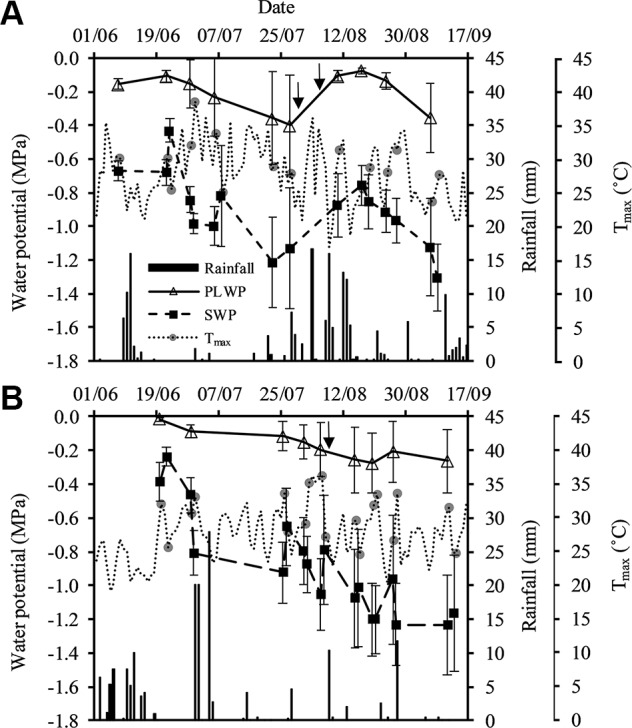
Figure 1.

Seasonal pattern of stem water potential and predawn leaf water potential on the primary axis, and precipitation and Tmax on the secondary axis in (A) Saint-Émilion in 2015 and (B) Margaux in 2018. Tmax at the days of sampling are specifically represented by the gray circles. Vertical arrows represent dates of mid-veraison for Merlot (30/07) and Cabernet franc (08/08) in 2015, and Merlot and Cabernet Sauvignon (08/08) in 2018. Values are averages over plots as described in Table 1 . Error bars indicate standard deviations.
