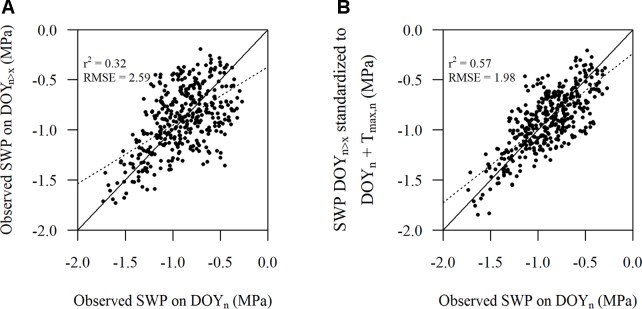
Figure 5.
Comparison of (A) the observed stem water potential (SWP) on DOYn versus the observed SWP on DOYn>x, where x is at least greater than 2 days and has a predawn leaf water potential almost equal to the observed SWP on DOYn and (B) the observed SWP on DOYn versus the observed SWP at that later date standardized according to Eqn. 2. The solid line represents the 1:1 line and the dotted line represents the linear regression (n = 385).

