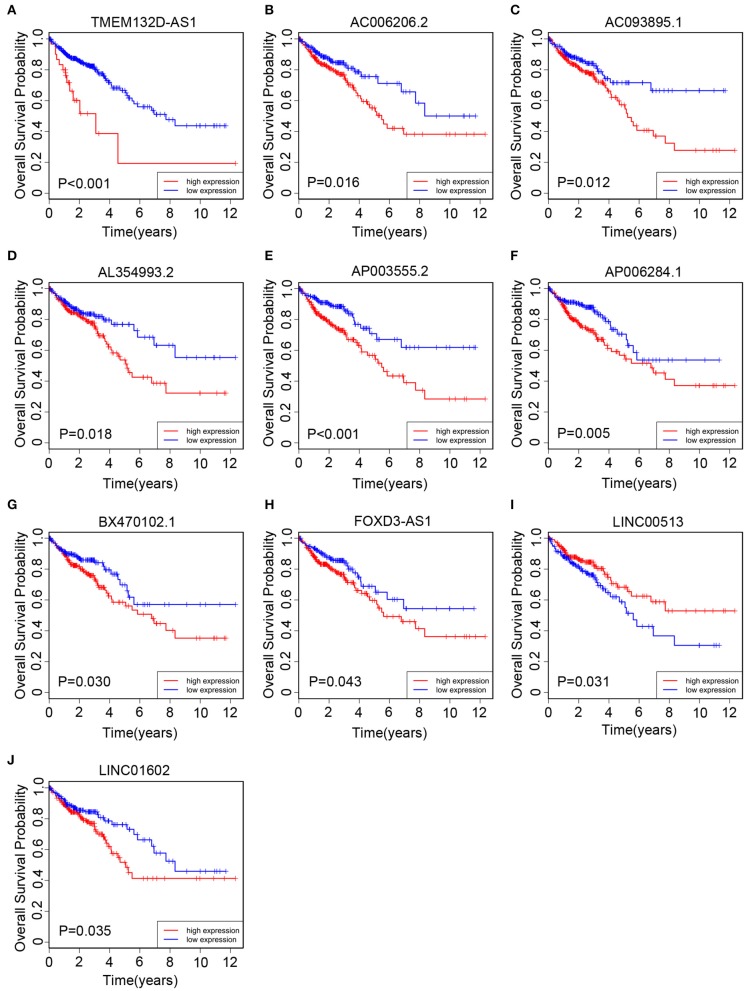
Figure 3.
The Kaplan–Meier curve of 10 prognostic lncRNAs in CRC patients collected from The Cancer Genome Atlas (TCGA) cohort. The Kaplan–Meier curve for (A) TMEM132D-AS1, (B) AC006206.2, (C) AC093895.1, (D) AL354993.2, (E) AP003555.2, (F) AP006284.1, (G) BX470102.1, (H) FOXD3-AS1, (I) LINC00513, and (J) LINC01602.

