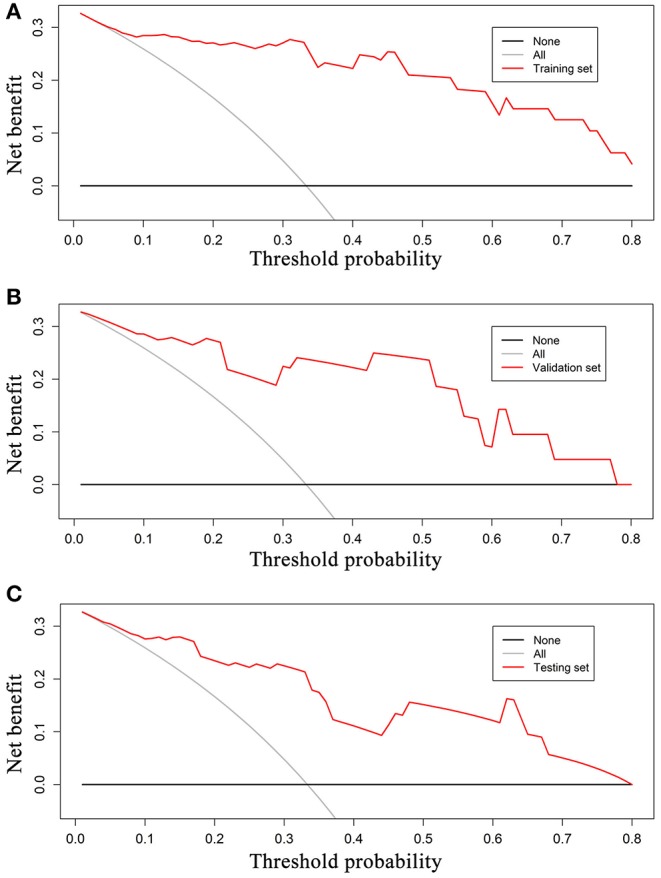
Figure 9.

Decision curves for radiomics models in training (A), validation (B), and testing sets (C). The grey reference line indicates the assumption that all patients are diagnosed to be MSI CRC; black dashed reference line indicates the assumption that all patients are diagnosed to be MSS CRC. In training, validation, testing sets, the net benefit is 17.44, 15.40, and 13.43, respectively. A larger area under the decision curve indicates a better clinical utility. MSI, microsatellite instability; CRC, colorectal cancer; MSS, microsatellite stability.
