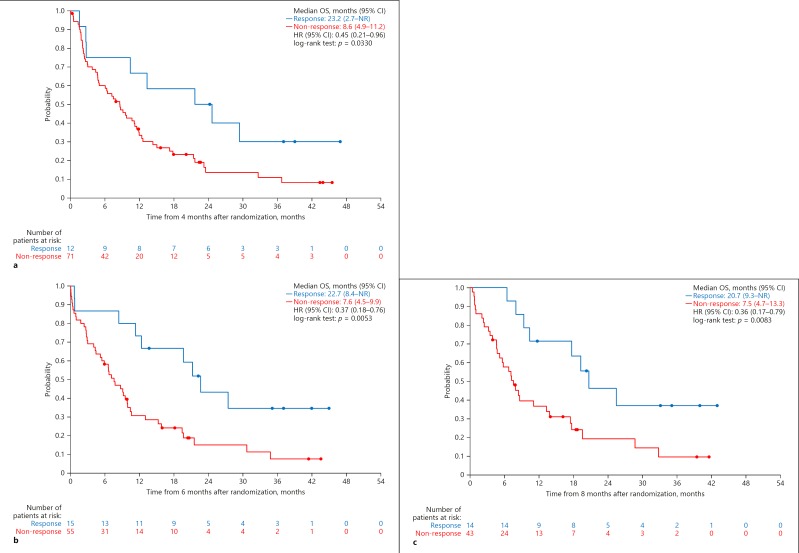
Fig. 4.
a Landmark analyses for OS by OR assessed by mRECIST in the sorafenib alone group (landmark Kaplan-Meier curve as function of tumor response at 4 months). b Landmark analyses for OS by OR assessed by mRECIST in the sorafenib alone group (landmark Kaplan-Meier curve as function of tumor response at 6 months). c Landmark analyses for OS by OR assessed by mRECIST in the sorafenib alone group (landmark Kaplan-Meier curve as function of tumor response at 8 months). NR, not reached.

