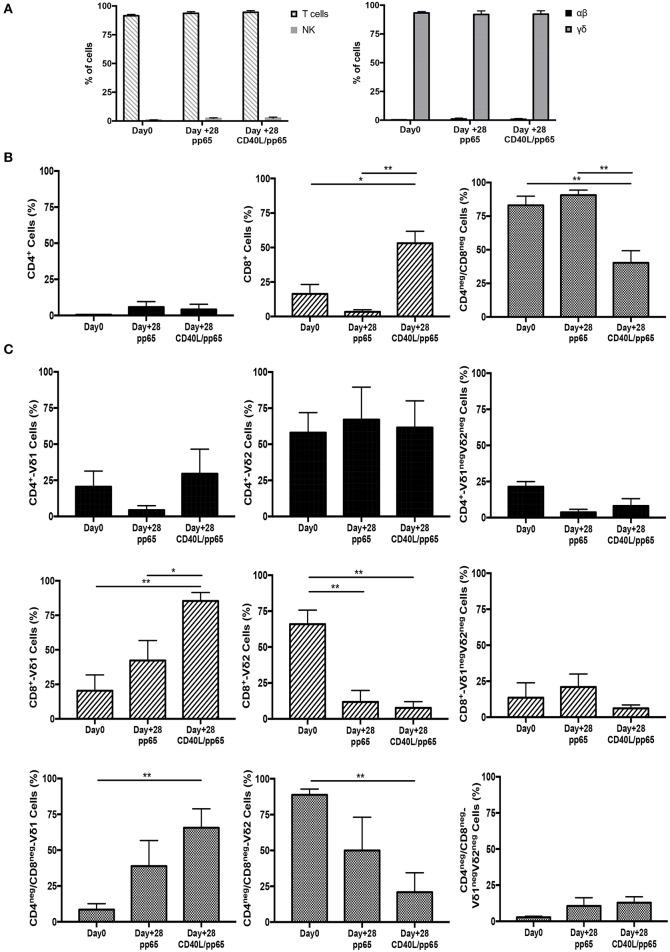
Figure 2.
Phenotype of freshly isolated and expanded γδ-T cells stimulated with aAPCs/pp65 and CD40L/pp65. Evaluation of T cells, NK cells, as well as of αβ and γδ-T cell subset distribution, in freshly isolated and expanded γδ-T cells (n = 7) (A). (B) displays the flow-cytometry analysis of the CD4+, CD8+, and CD4neg/CD8neg cell content within the freshly isolated and expanded γδ-T cells (n = 4). Distributions of Vδ1, Vδ2, and Vδ1negVδ2neg subpopulations within the CD4+, CD8+, and CD4neg/CD8neg in freshly isolated and expanded γδ-T cells are displayed in panels (n = 4) (C). Data summarised as average ± SEM of 4–7 donors. *p < 0.05; **p < 0.01.

