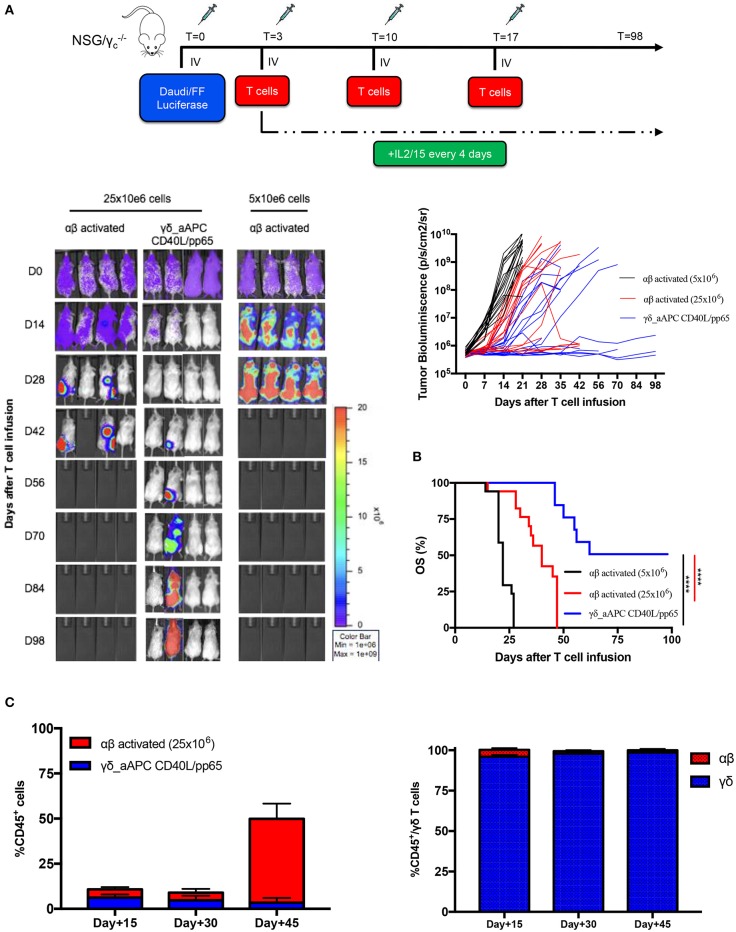
Figure 6.
In vivo anti-tumour analysis of expanded γδ-T cells. (A) shows the experimental design and the in vivo bioluminescence imaging of NSG mice engrafted with Daudi leukaemia cell line and treated with either polyclonally activated αβ-T cells or γδ CD40L/pp65 T cells. Four representative mice per group are reported; bioluminescence of each single mouse treated with polyclonally activated αβ-T cells (5 × 10⁶ cells) (black line; 17 mice), polyclonally activated αβ-T cells (25 × 106 cells) (red line; 17 mice) and γδ CD40L/pp65 T cells (blue line; 17 mice) (A). Kaplan-Meier estimate of OS in tumour-bearing mice treated with either polyclonally activated αβ-T cells (5 × 10⁶ cells) (black line; 17 mice), polyclonally activated αβ-T cells (25 × 106 cells) (red line; 17 mice), or γδ CD40L/pp65 T cells (blue line; 17 mice) (B). Circulating CD45+, γδ-T, and αβ-T cells overtime persistence evaluation in treated mice (C). Data summarised as average ± SEM. Log-rank (Mantel-Cox). ****p < 0.0001.

