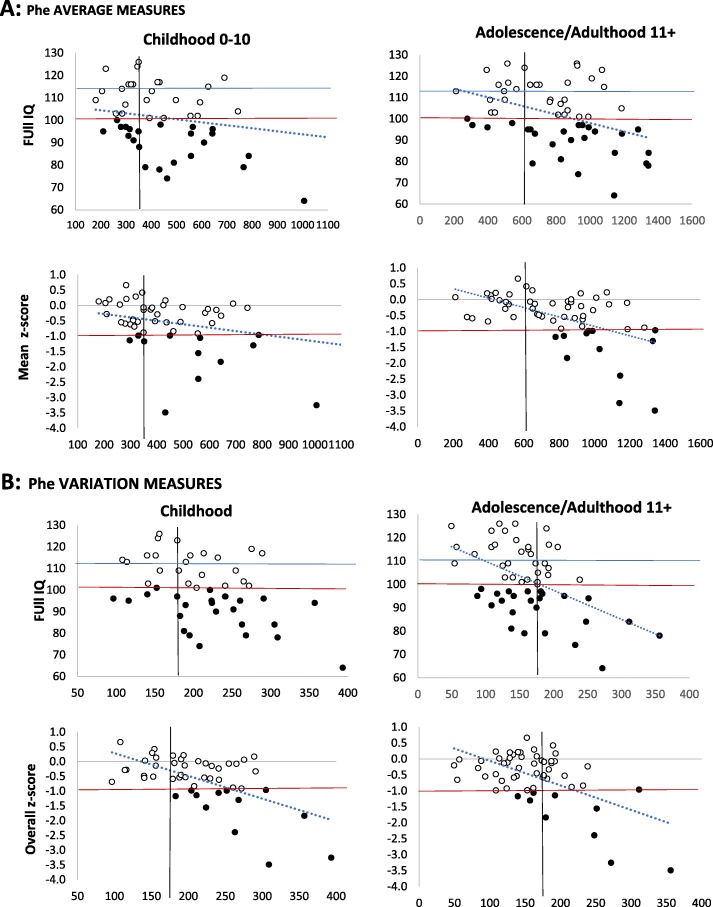
Fig. 2.
Cognitive outcomes in terms of IQ and overall z -score in our cognitive battery in relation to metabolic control. Panel A shows metabolic control in terms of Phe average levels in childhood and later on. Panel B shows metabolic control in term of Phe variation in childhood and later on. Note z-scores are depicted in figure so that both high IQ and high z-scores indicate good performance. The top horizontal line indicates average performance according to control group. The bottom horizontal line indicates performance = < 1SD from control average (FIQ for controls = 112.3; SD = 11.3; cut off 1 SD = 101). The black dots correspond to poor scores. The vertical lines indicate possible safety criteria (for Phe average < 360 in childhood < 600 afterwards; for SD < 180)

