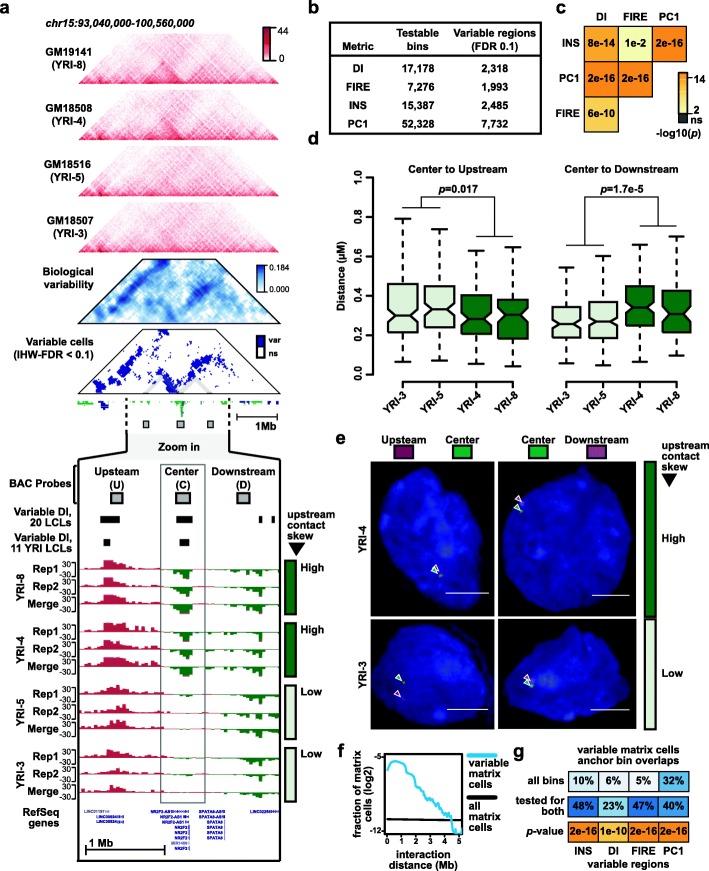
Fig. 2.
Variable regions of 3D chromatin conformation. a Example of a variable region (chr15:93,040,000-100,560,000; hg19). Triangular heatmaps from top to bottom: Four Hi-C contact heatmaps from individuals showing variable 3D chromatin architecture, a heatmap in blue showing the degree of variation measured across LCLs, and a second heatmap in blue showing variable cells in the matrix at IHW-FDR < 0.1 (var = variable, ns = not significant). Standard tracks from top to bottom (zoomed in on chr15:95,482,152-98,025,591; hg19): BAC probes used for FISH experiment in panels d and e, variable DI regions called using all 20 LCLs, variable DI regions called using just 11 YRI LCLs, 12 DI tracks from four different individuals. For each individual, DI tracks are shown from two biological replicates and from Hi-C data merged across both replicates. As indicated to the right of the tracks, two individuals have strong upstream contact skew in the boxed regions (YRI-4, YRI-8), while the other two individuals have weak or no upstream contact skew in that region (YRI-3, YRI-5). b The number of testable bins and significantly variable regions for each 3D chromatin phenotype examined here. c Significance of pairwise overlap between different sets of variable regions. p values calculated by chi-square test. Additional details in the “Methods” section and Additional file 1: Figure S5 and S6. d Boxplots showing the distance between indicated probe sets in four different LCLs. Probe labels same as in panel a. p values calculated by two-sided Wilcoxon rank-sum test. Number of nuclei measured for each LCL and probe pair, from left to right, are 140, 91, 111, 70, 128, 124, 219, 70. e Representative images of nuclei corresponding to panel d. f Blue line shows the fraction of variable matrix cells distributed across a range of interaction distances. Black shows the fraction of all matrix cells distributed across the same range of interaction distances. g Top panel shows the percentage of all variable matrix cell anchor bins that overlap variable INS, FIRE, INS, or PC1 regions, respectively. Middle panel is similar to top, but only including variable matrix cell anchor bins that were also tested for INS, FIRE, INS, or PC1 variability. The shade of blue is scaled with overlap percentage. Bottom panel shows the statistical significance of overlaps as calculated by chi-square test, and plotted with same color scale as (c)

