Fig. 6.
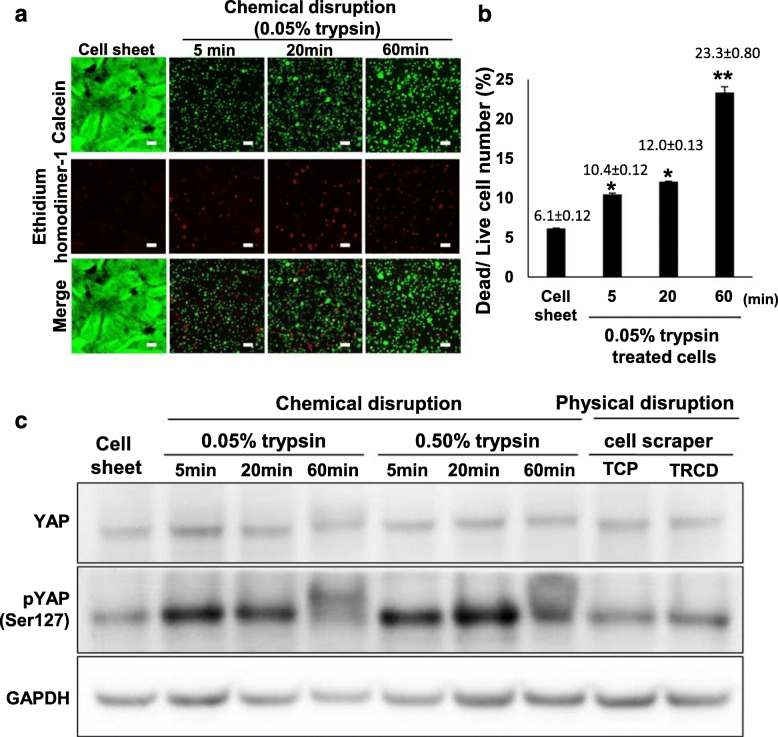
Cell viability of cell sheets. a, b Live–dead cell viability assay: a live (green) and dead (red) staining of cell sheet and cell suspension produced by chemical disruption. b Live cell and dead cell ratio was calculated using ImageJ. c Cell mechanosensor expression analysis of YAP proteins using western blot. YAP, pYAP, and GAPDH in whole cell lysates (10 μg protein/lane). Scale bar = 100 μm

