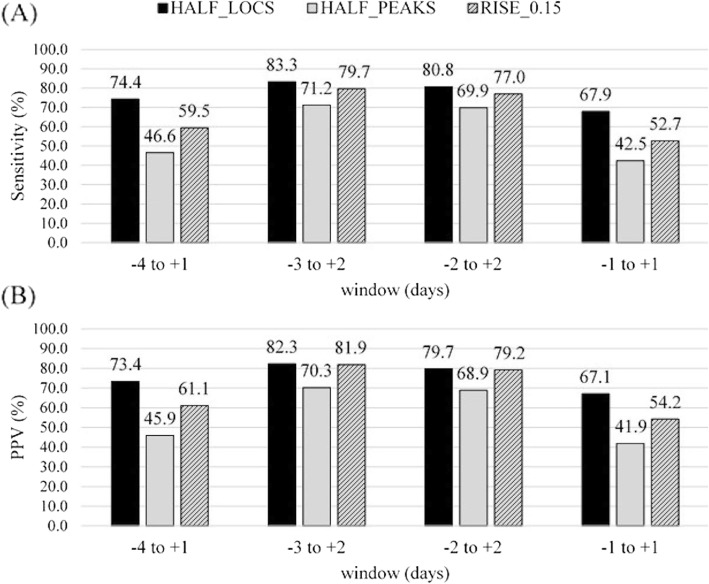
Fig. 5.
Ovulation prediction (a) sensitivities and (b) positive predictive values (PPV). Sensitivities and PPVs calculated for algorithms HALF_LOCS (TP + FN = 78), HALF_PEAKS (TP + FN = 73), and RISE_0.15 (TP + FN = 74) with different windows. The differences in the number of TP + FN are caused by the different data availability requirements of the algorithms

