Fig. 10.

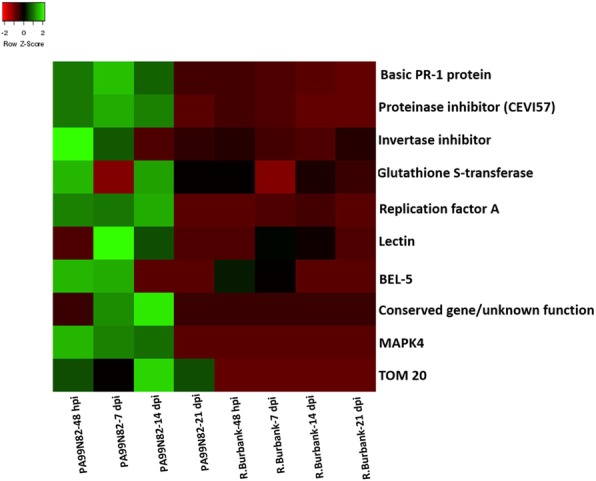
Heat map showing the expression pattern (FPKM) of all genes across all the time points in the resistant clone (PA99N82–4) and the susceptible clone (Russet Burbank) validated using qPCR

Heat map showing the expression pattern (FPKM) of all genes across all the time points in the resistant clone (PA99N82–4) and the susceptible clone (Russet Burbank) validated using qPCR