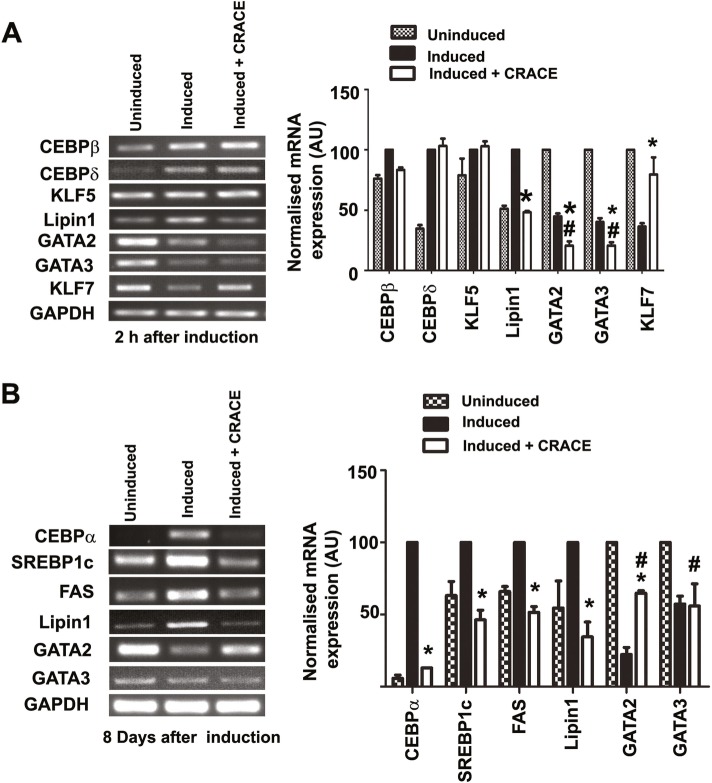
Fig. 2.
CRACE modulated expression of pro- and anti-adipogenic regulators at early and late stage of adipogenesis. a. Gel images and bar diagram/diagrams represent RT-PCR analysis of early adipogenic regulators expressions in presence and absence of CRACE (500 μg/mL equivalent); after 2 h of induction of adipogenesis in 3T3-L1 cells. b. Gel images and bar diagram represent RT-PCR analysis of adipogenic regulators expressions in presence and absence of CRACE (500 μg/mL equivalent); at the late stage of adipogenesis (8 days post adipogenesis induction in 3T3-L1 cells). Bars represent mean ± SEM. n = 3. GAPDH mRNA expression was used as internal control. Unpaired t-test was performed to study the statistical significance. * represents p < 0.05 for “Induced” vs “Induced + CRACE”. # represents p < 0.05 for “Uninduced” vs. “Induced + CRACE”

