Fig. 5.
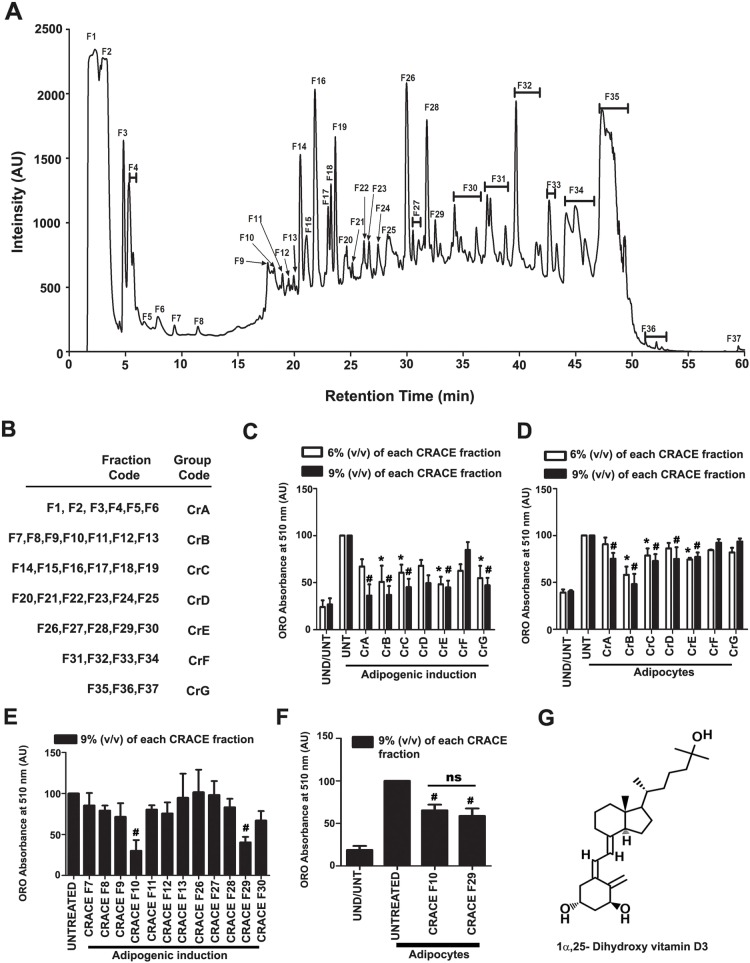
1α, 25-dihydroxy vitamin D3 was present in most active fractions in CRACE. a. HPLC Chromatogram of fractionation of CRACE. 200 μL of 10 mg/mL of CRACE was fractionated and later the dried fractions were dissolved again with 200 μL of sterile milli Q water. b. Fractions were grouped into 7 preparations named as CrA, CrB, CrC, CrD, CrE, CrF and CrG. c. CRACE fraction groups CrB and CrE decreased 3 T3-L1 differentiation most efficiently. The cells received treatments with all the grouped CRACE fractions (at 6 and 9% v/v for each fraction) for first 4 days of adipogenic induction. Thereafter, the cells were allowed to be maintained for another 4 days before ORO staining was performed. Bars represent mean ± SEM, n = 3. Two-way ANOVA followed by Bonferroni post-test was performed to evaluate the statistical significance. * indicates p < 0.05 for induced-untreated (UNT) vs. induced- 6% treated. # represents p < 0.05 for induced-untreated (UNT) vs. induced- 9% treated groups. d. Fraction group CrB inhibited lipid accumulation in mature adipocytes most efficiently. Mature adipocytes with equal amount of lipid received treatment with all the grouped fractions (6 and 9% v/v) for 4 days. Post treatment lipid content was measured by ORO staining. Bars represent mean ± SEM, n = 3. Two-way ANOVA followed by Bonferroni post-test was performed to evaluate the statistical significance. * and # indicate same as panel c. e. All the fractions in group b and e were tested in the same manner as C at 9% v/v for their effect on adipocyte differentiation. Fraction F10 and F29 appeared as active fractions in CrB and CrE respectively. Bars represent mean ± SEM, n = 3. One-way ANOVA followed by Bonferroni post-test was performed to the evaluate statistical significance. # indicates same as panel c. f. Fraction F10 and F29 were tested in the same manner as D at 9% v/v for their effect on reduction of fat accumulation in mature adipocytes. Both the fractions reduced accumulated lipid in mature adipocytes. Bars represent mean ± SEM, n = 3. One-way ANOVA followed by Bonferroni post-test was performed to evaluate the statistical significance. # indicates same as panel c. g. 1α, 25-dihydroxy vitamin D3 is the common molecule which is present in F10 and F29 as major constituent

