Figure 3.
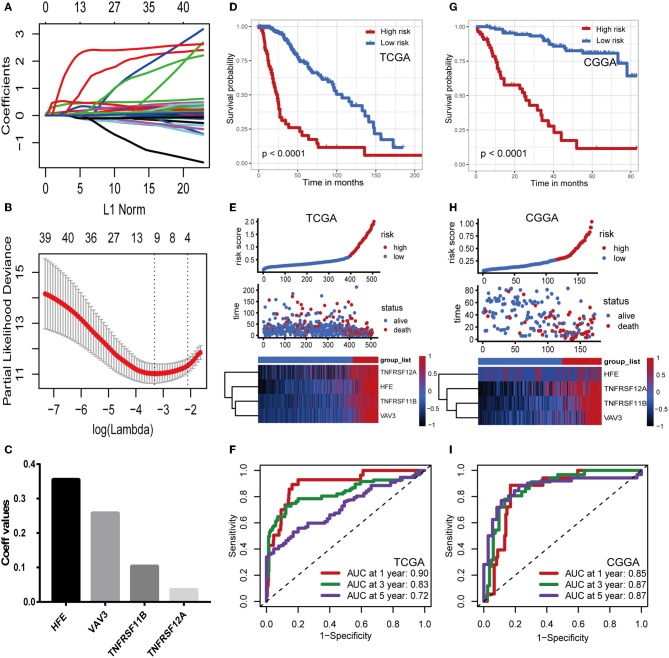
Construction and validation of the immune prognostic signature. (A,B) LASSO Cox analysis identified four genes most correlated to overall survival in TCGA set. (C) Coefficient values for each of the four selected genes. (D,G) Kaplan–Meier curves of overall survival for LGG patients based on the IPS in TCGA cohort and CGGA cohort. (E,H) Risk scores distribution, survival status of each patient, and heatmaps of prognostic four-gene signature in TCGA and CGGA cohorts. (F,I) Time-dependent ROC curve analysis of the IPS.

