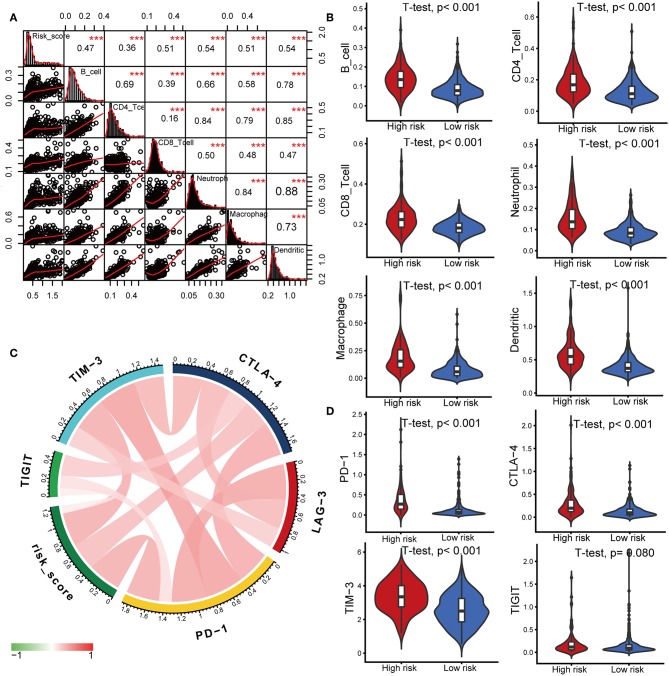
Figure 6.
Correlations of the IPS with infiltrating immune cell proportions and immune checkpoints. (A) Correlation of the risk score with infiltrating immune cell proportions. Pearson's correlation coefficient values with the level of significance were shown on the top of the diagonal. ***P < 0.001. (B) Violin plots visualizing significantly different immune cell proportions between high- and low-risk patients. (C) Correlation of the risk score with the expression of several crucial immune checkpoints (D) Violin plots visualizing significantly different immune checkpoints between high- and low-risk patients.

