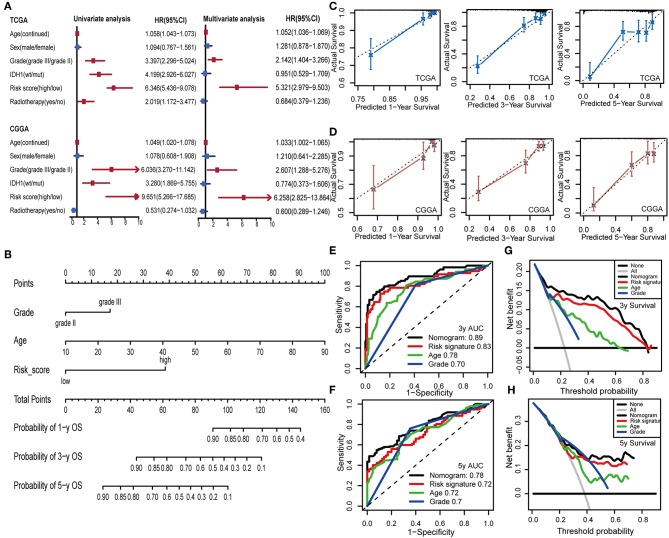
Figure 8.
Construction and validation of the nomogram model. (A) Univariate and multivariate Cox analyses indicated that IPS was significantly associated with OS in both TCGA and CGGA sets. Red indicates statistical significance, and blue indicates no statistical significance. (B) Nomogram model for predicting the probability of 1-, 3-, and 5-year OS in LGGs. (C,D) Calibration plots of the nomogram for predicting the probability of OS at 1, 3, and 5 years in TCGA and CGGA cohorts. (E,F) Time-dependent ROC curve analyses of the nomogram model, risk signature, age and tumor grade in TCGA cohort. (G,H) Decision curves of the nomogram predicting 3- and 5-year OS in TCGA cohort.

