Fig. 1.
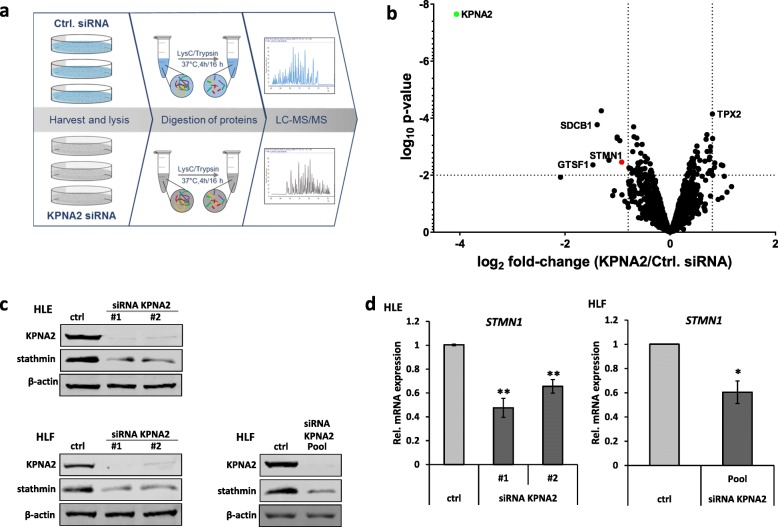
Stathmin is downregulated upon KPNA2 depletion. a Workflow of LC-MS/MS analysis. HLE cells were harvested 72 h after control (Ctrl.) or KPNA2 siRNA treatment (n = 3). b Volcano-Plot illustrates the resulting log2 fold-changes (KPNA2/Ctrl. siRNA) and corresponding log10 p-values of 1759 proteins being quantified by the LC-MS/MS analysis. Horizontal dotted line p = 0.01; vertical dotted lines log2 fold-change 0.8 or − 0.8; green dot: KPNA2; red dot: stathmin. c HLE and HLF cells were siRNA-treated and harvested as described in (a). Lysates were immunoblotted using the indicated antibodies. d HLE and HLF cells were treated as described in (a) and STMN1 expression was analyzed by qRT-PCR. (HLE: n = 5, p < 0.01 (**); HLF: n = 4, p < 0.05(*))

