Fig. 1.
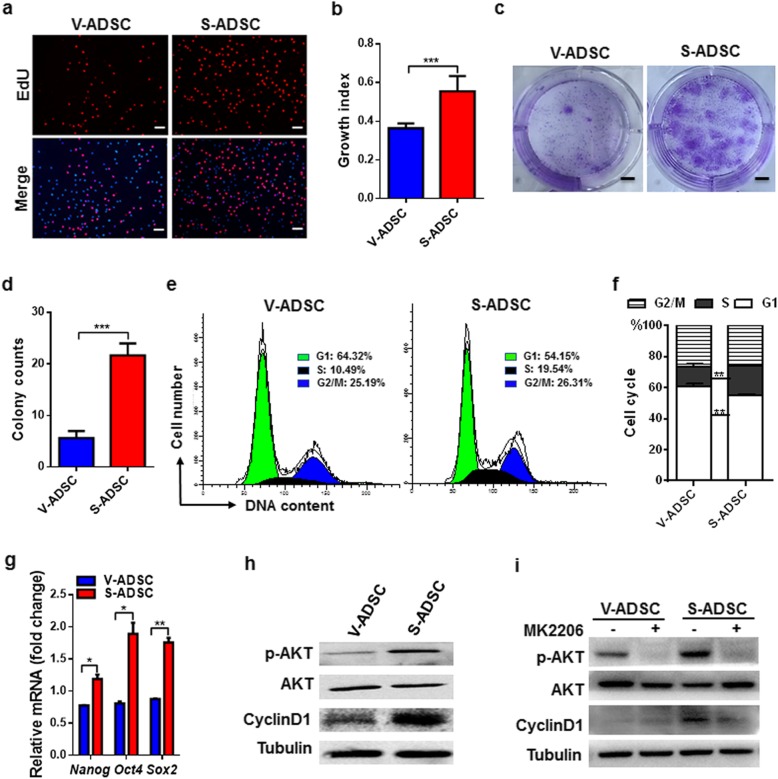
S-ADSCs show higher potential in proliferation than V-ADSCs through promoting AKT activation. S-ADSCs and V-ADSCs from inguinal and epididymal adipose tissue of the mice (n = 10) were used in the following experiments. a, b Cell proliferation was determined by EdU incorporation assay. Fluorescence signals were examined by fluorescence microscope, and growth index (number of EdU-positive nuclei/number of all nuclei) was calculated. Representative (a) and statistic (b) data are shown. Scale bar 100 μm. c, d Colony formation was measured by crystal violet staining. Representative (c) and statistic (d) data are shown. Scale bar 8.5 mm. e, f Cell cycle profiles were analyzed by flow cytometry after PI staining. Representative (e) and statistic (f) data are shown. g The expression of stemness genes was measured by qPCR. h, i Protein levels of p-AKT, AKT, and CyclinD1 were detected on S-ADSCs and V-ADSCs in the absence (h) or presence (i) of MK2206 (2 μM) for 20 h by western blot. Data are presented as mean ± SEM. n = 3–5 per group. *P < 0.05, **P < 0.01, ***P < 0.001

