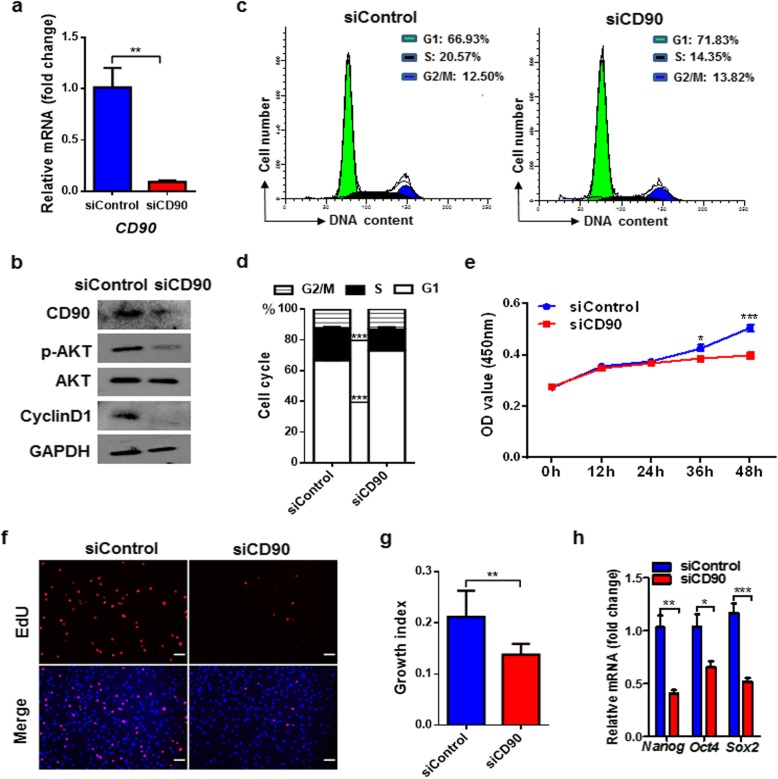
Fig. 4.
CD90 silencing inhibits proliferation of S-ADSCs by attenuating AKT activation. S-ADSCs from mice (n = 10) were transfected with siCD90 or siControl for 24 h and then were collected for assays. a The mRNA level of CD90 was detected by qPCR. b Protein levels of CD90, p-AKT, AKT, and CyclinD1 were detected by western blot. c, d Cell cycle profile was analyzed by flow cytometry after PI staining; typical (c) and statistic (d) data are shown. e Grow curve was determined by CCK-8 assay (n = 15 per condition). f, g Cell proliferation was determined by EdU incorporation assay. Fluorescence signals were examined by fluorescence microscope (f). Scale bar 100 μm. Growth indices as specified in Fig. 1 are shown (g). h The mRNA levels of stemness markers were measured by qPCR. Data are presented as mean ± SEM. n = 3–6 per group. *P < 0.05, **P < 0.01, ***P < 0.001

