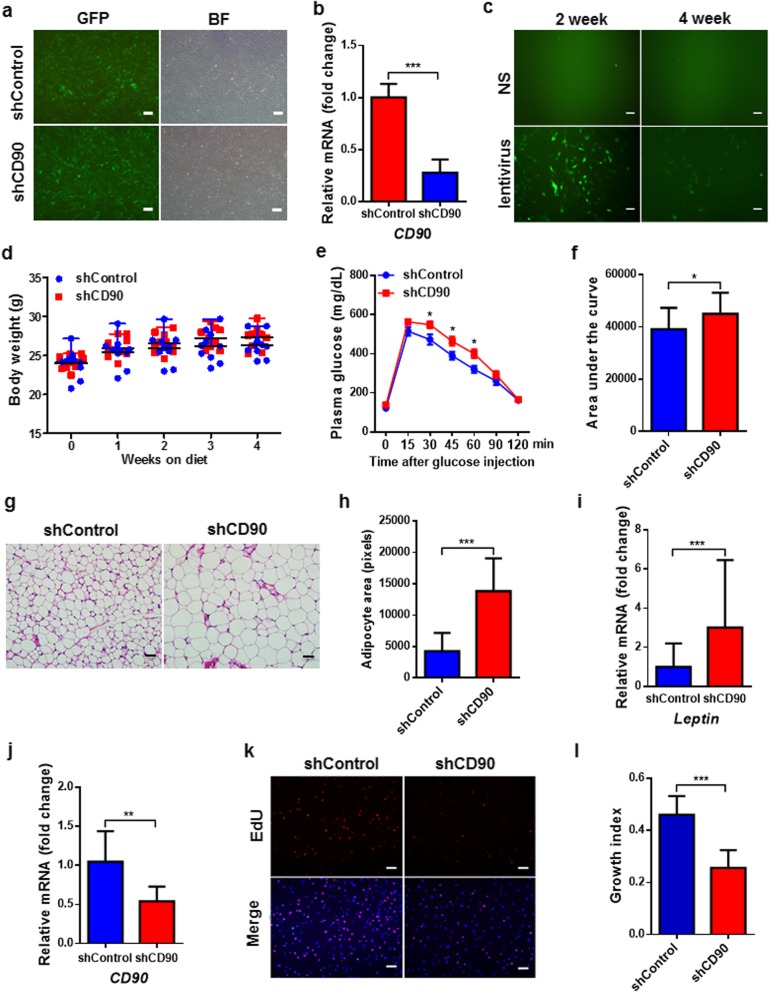
Fig. 6.
CD90 silencing causes glucose intolerance and adipocyte hypertrophy in mice. a, b S-ADSCs were infected with GFP-tagged shControl or shCD90 lentivirus (Genechem). The infection efficiency was determined by GFP signals under fluorescence microscope (a). BF, bright field. Scale bar = 100 μm. The mRNA level of CD90 was detected by qPCR (b). c GFP-tagged shControl lentivirus was injected into bilateral inguinal fat pads (7.0 × 10⁶ TU per point, 3 points per fat pad) of male mice at the age of 8 weeks. After 2 or 4 weeks, ADSCs were isolated from inguinal SAT to examine GFP signals under fluorescence microscope. Scale bar = 50 μm. NS, normal saline. d–l Mice (n = 10 per group) at the age of 8 weeks were injected with shCD90 (or shControl) lentivirus as mentioned above. The body weight (d) was recorded during 4 weeks of treatment. After 3 weeks of treatment, GTT was performed in mice with overnight fast; glucose levels (e) were determined at different time points after glucose injection. Areas under the curve (f) for GTT are shown. The inguinal SAT section was stained with H&E (g), and the areas of adipocytes were measured as pixies using Image-Pro Plus 6.0 (h). Scale bar = 50 μm. The mRNA level of Leptin in inguinal SAT was detected by qPCR (i). S-ADSCs from inguinal SAT were examined for the mRNA level of CD90 by qPCR (j) and proliferation by EDU incorporation assay. Fluorescence signals (k) detected by fluorescence microscope and growth indices (l) as specified in Fig. 1 are shown. Scale bar = 100 μm. Bars represent mean ± SEM. *P < 0.05, **P < 0.01, ***P < 0.001

