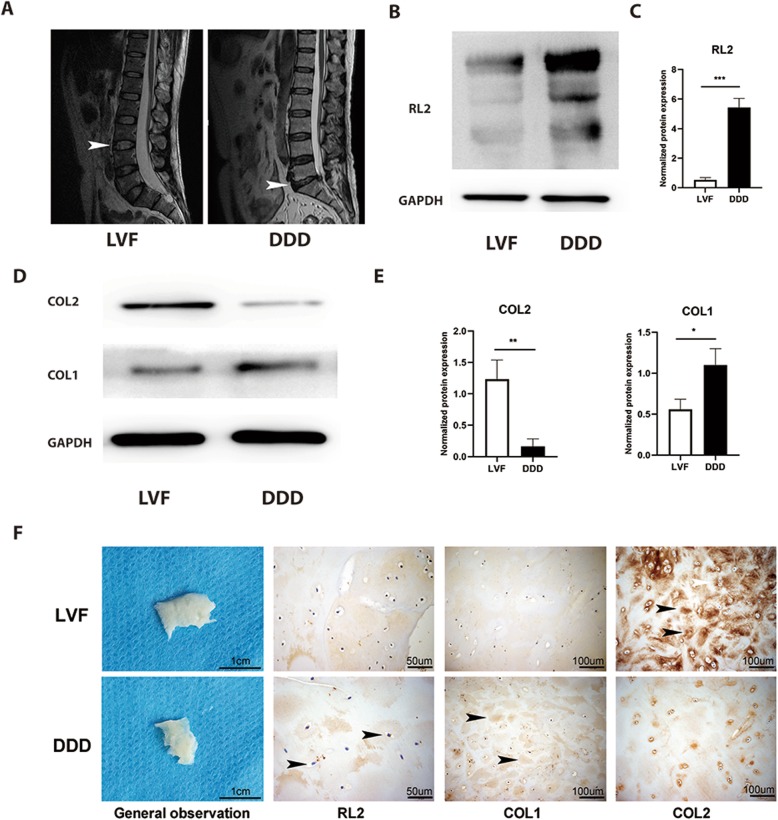
Fig. 1.
DDD CEPs exposed to normal glucose exhibited less chondrogenesis and more osteogenesis than LVF CEPs. a Representative MRI of patients. Patients with LVF were classified as grade 1, and patients with lumbar DDD were classified as grade 6 according to the Pfirrmann classification system. b, c Western blot (b) and analysis (b) of protein O-GlcNAcylation (RL2). Protein content was measured by densitometry and normalized according to GAPDH level. d, e Western blot (d) and analysis (e) of the expressions of COL1 and COL2. The proteins were normalized according to GAPDH level. f General observation of samples and immunohistochemical staining of tissue sections. Arrowheads indicate positively stained collagen matrix, cells, or protein. Data represent the mean ± SD (n = 3 independent experiments, t test). *p < 0.05, **p < 0.01, and ***p < 0.001

