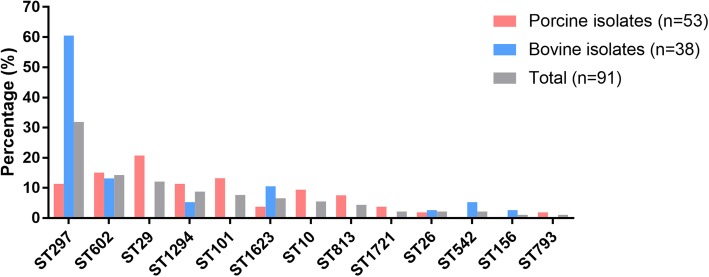
Fig. 5.
Distribution of the sequence types (STs) among the STEC isolates. Columns in pink displays the percentage of STECs isolated from the feces and intestinal contents of pigs; Columns in sky blue displays the percentage of STECs isolated from the feces of cows; Columns in gray displays the percentage of the total STECs isolated herein (STECs from pigs plus STECs from cows)

