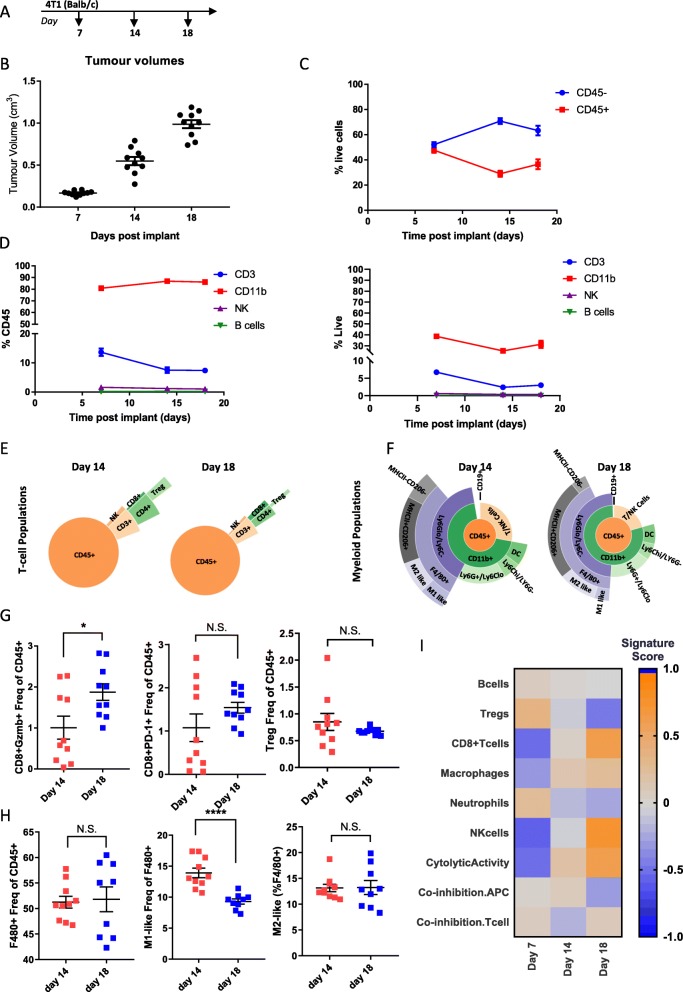
Fig. 4.
Changes in immune infiltrate over the course of 4T1 tumor development. (a) Schematic of sample collection. (b) Tumor volumes on indicated day post implant. (c) Proportion of CD45- to CD45+ cells measured at each timepoint by flow cytometry (d) Proportion of CD3+, CD11b, NK, and B-cells as a percent of CD45+ cells (left) or as a percent of live cells (right) measured by flow cytometry. (e) Sunburst plots showing T-cell and NK cell populations as a proportion of CD45+ cells. (f) Sunburst plots showing the proportion of myeloid cell populations as a proportion of CD45+ cells. (g) Flow cytometry data for individual CD8+ T-cell populations (h) Flow cytometry data for individual macrophage populations. (i) Gene expression data generated from a panel of 96 genes was used to calculate a GSVA score [4, 5] indicating enrichment for specific immune cell types at each timepoint. Flow cytometry data is n=10 for all timepoints. Sunburst plots show data from a pool of samples or a representative sample. For GSVA scores n=10 for day 7 and day 14 and n=9 for day 18. Statistical significance is indicated as *p<0.05, **p<0.01,***p<0.001, ****p<0.0001. Data for sunburst plots available in Additional file 6: Table S6

