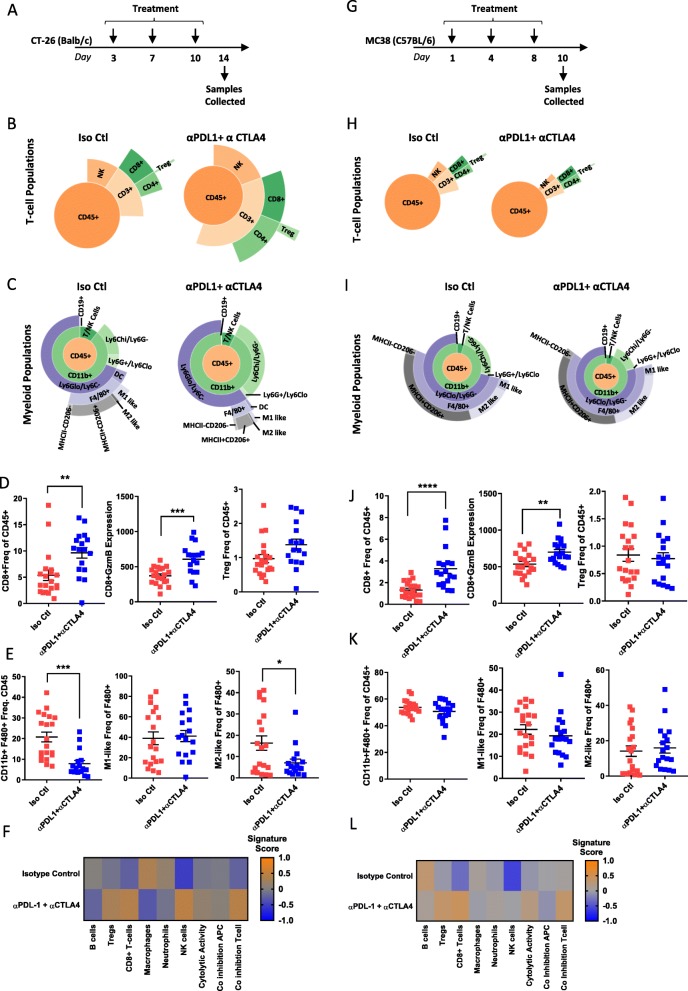
Fig. 5.
Checkpoint inhibition results in dynamic changes in immune infiltrate in CT-26. (a) Schematic of treatment and sample collection in CT-26 model. (b) Representative sunburst plot showing T-cell population changes after α-mPD-L1+ α-mCTLA-4 treatment in CT-26 tumors. (c) Representative sunburst plot showing changes in myeloid populations after α-mPD-L1+ α-CTLA-4 treatment in CT-26 tumors. (d) Flow cytometry data for individual T-cell populations from isotype control treated (n=20) or α-mPD-L1+ α-CTLA-4 treated (n=17) tumors. (e) Flow cytometry data for individual macrophage populations from isotype control treated (n=20) or α-mPD-L1+ α-CTLA-4 treated (n=17) tumors. (f) Gene expression data generated from a panel of 96 genes was used to calculate a GSVA score [4, 5] indicating enrichment for specific immune cell types after treatment with isotype control (n=10) or α-mPD-L1+ α-CTLA-4 (n=9) in CT-26 tumors. (g) Schematic of Treatment and sample collection in MC38 model. (h) Representative sunburst plots showing T-cell population changes after α-mPD-L1+ α-mCTLA-4 treatment in MC38 tumors. (i) Representative sunburst plots showing changes in myeloid populations after α-mPD-L1+ α-mCTLA-4 treatment in MC38 tumors. (j) Flow cytometry data for individual T-cell populations from isotype control treated (n=20) or α-mPD-L1+ α-CTLA-4 treated (n=18) tumors. (k) Flow cytometry data for individual macrophage populations from isotype control treated (n=20) or α-mPD-L1+ α-CTLA-4 treated (n=18) tumors. (l) Gene expression data generated from a panel of 96 genes was used to calculate a GSVA score [4, 5] indicating enrichment for specific immune cell types after isotype control (n=6) or α-mPD-L1+ α-CTLA-4 (n=9) treatment in MC38 tumors. Data for sunburst plots available in Additional files 7, 8: Tables S7 and S8

