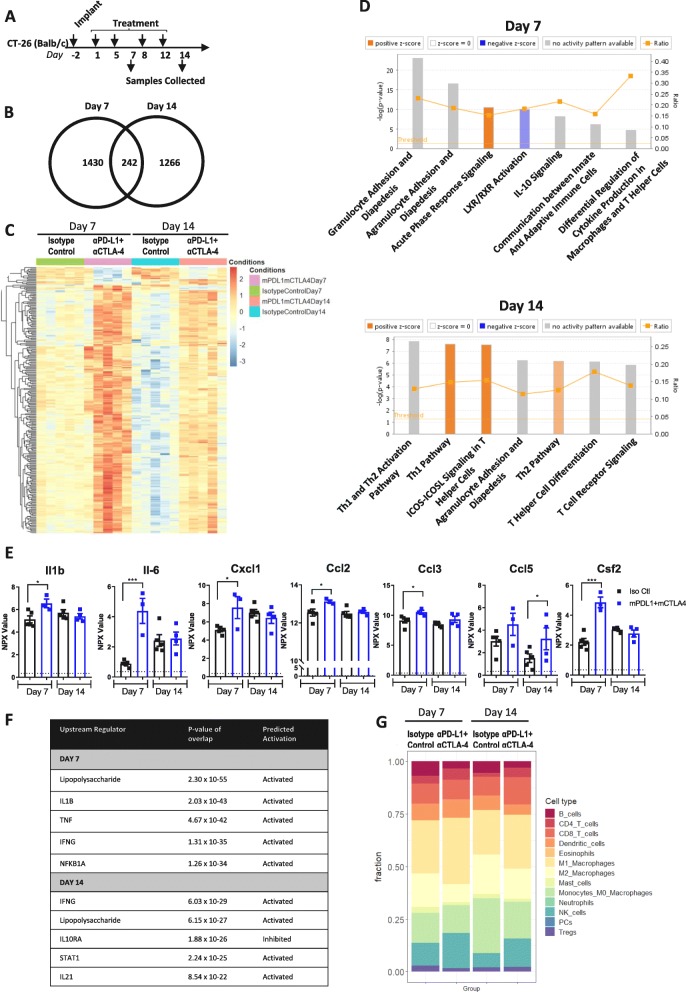
Fig. 6.
Checkpoint inhibition results in enhanced inflammation and T-cell response in CT-26 syngeneic tumors. (a) Schematic of dosing and sample collection. (b) Venn diagram indicating the number of genes regulated by checkpoint inhibition at each timepoint. (c) Heat map analysis of 242 differentially expressed genes between control and α-mPD-L1 + α-mCTLA-4 treatment at both day 7 and day 14. (d) IPA pathway analysis of differentially expressed genes. Z-score indicates a pathway with genes exhibiting overall increase mRNA levels (orange bars) or decreased mRNA levels (blue bars). The ratio (orange line) indicates the ratio of genes from the dataset that map to the same pathway. (e) Normalized protein expression (NPX) levels of chemokines measured by O-link PEA assay. (f) Upstream regulator pathways from IPA pathway analysis. (g) Quantification of immune cellular subtypes based on RNAseq gene signatures between Isotype Control and α-mPD-L1+ α-mCTLA-4 treated samples taken at day 7 and day 14 time points. Statistical significance is indicated as *p<0.05, **p<0.01,***p<0.001, ****p<0.0001, n=5 for RNAseq, n= 3-5 for PEA

