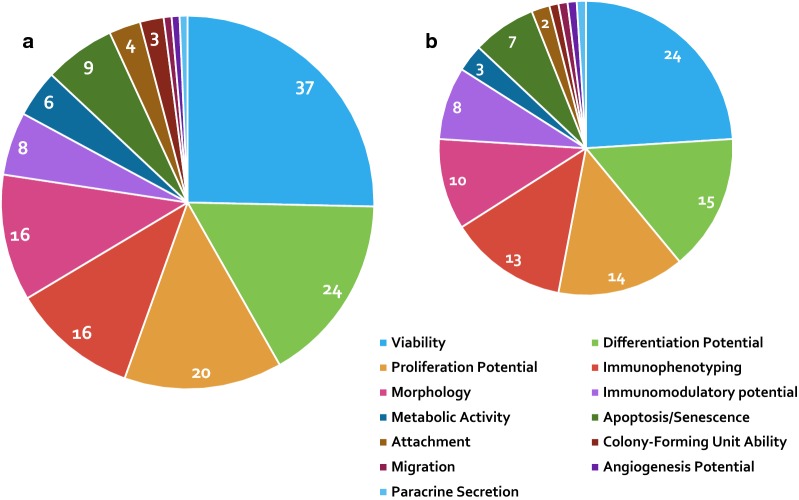
Fig. 3.
a Pie chart showing the proportion of the retained studies assessing different cellular attributes in all species. b Pie chart illustrating the proportion of human retained studies assessing different cellular attributes. It is supported by Additional file 1 which aggregates and delineates which studies undertook which analyses in a tabular form [arranged by species: human (chronologically and then alphabetically) and animals from most to least frequent species (chronologically and then alphabetically)]. Additional file 1 is a grid identifying which cell attributes each of the forty-one studies assessed. Of note each of the 41 studies may appear more than once depending on the attributes they assessed

