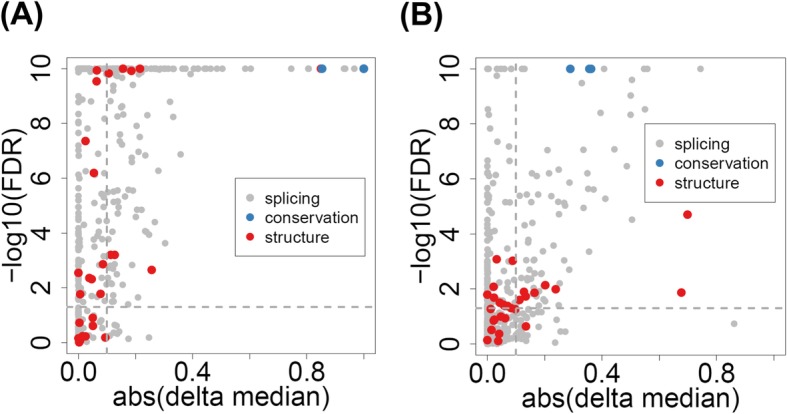
Fig. 2.

Feature evaluation. Significance of difference in feature scores between pathogenic and neutral iSNVs. a on-ss iSNVs. b off-ss iSNVs. Features were from three categories—splicing (gray), protein structure (red), and evolutionary conservation (blue). See also Additional file 2: Table S1 for more details. In the plot, every dot represents a feature. The x-axis is (the absolute value of) the feature’s delta median, calculated as the “median score of pathogenic iSNVs” minus the “median score of neutral iSNVs” of the particular feature. Calculations of feature scores were described in the “Methods” section. The y-axis is the significance value of the score difference based on Wilcoxon’s rank-sum test (p values adjusted by FDR and transformed by − log10, capped at 10−10 for display). Due to the large dynamic ranges of the feature values, the delta medians were rescaled to range [− 1, 1]: x’ = 2 × (x − min(x))/(max(x) − min(x)) − 1
