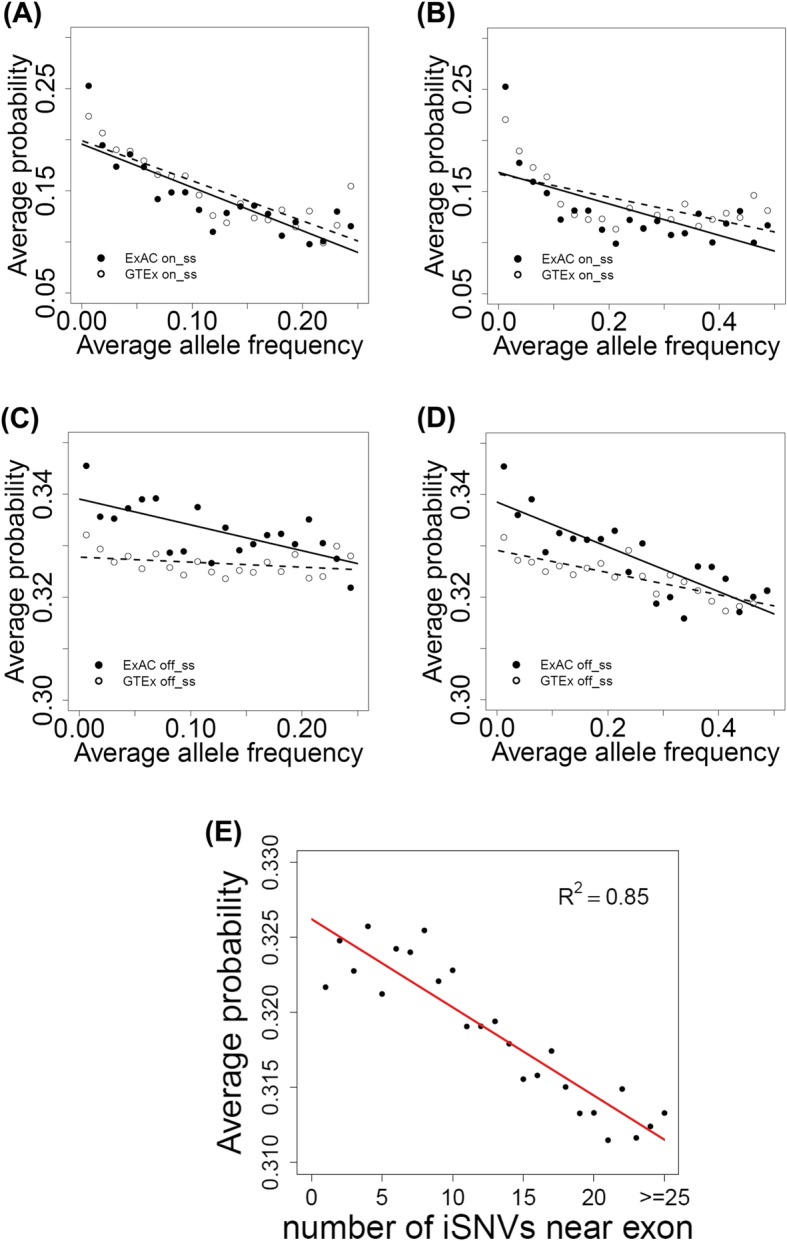
Fig. 4.

Correlations of disease-causing probability with allele frequency or number of nearby iSNVs for exon. a, b On-ss iSNVs. Correlation between disease-causing probability and allele frequency. Twenty bins were divided based on allele frequencies of the iSNVs collected from ExAC and GTEx. The x- and y-axes are the average allele frequency and predicted disease-causing probability for each bin. a Allele frequency scaled from 0.00 to 0.25. b Allele frequency scaled from 0.00 to 0.50. c, d Off-ss iSNVs, same as a, b. e Correlation between disease-causing probability and the number of exon-neighboring iSNVs. The x-axis is the number of exon-neighboring iSNVs (within 300 bp from the junction). Each value on the y-axis is the average (predicted) disease-causing probability of all exons having the number of neighboring iSNVs indicated by the corresponding value on the x-axis
