Fig. 5.
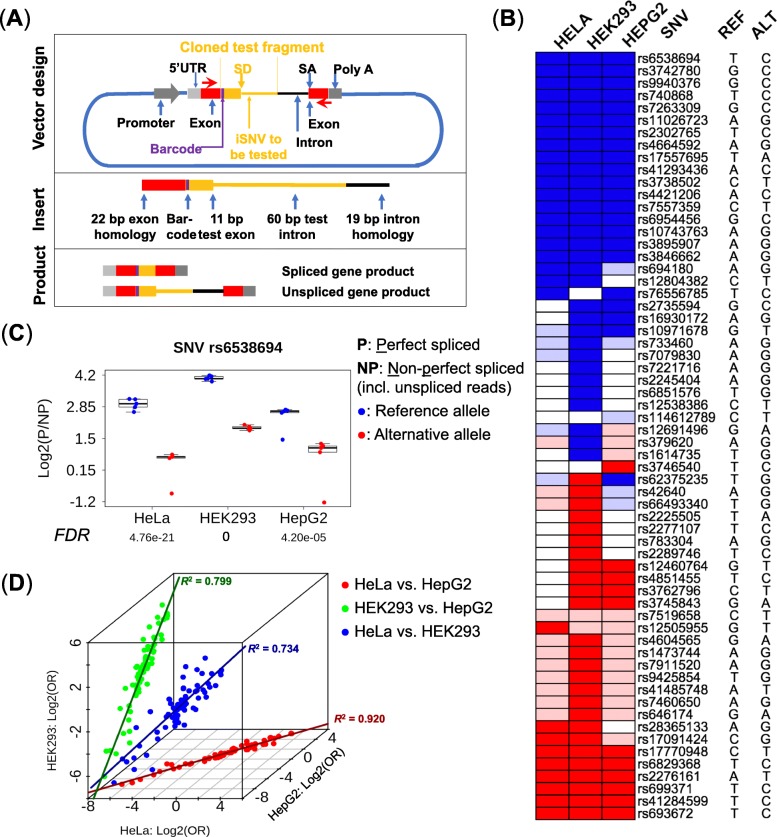
Experimental validation by ASSET-seq. a Plasmid design of the splicing assay. The insert oligo includes 11 bp of the proximal exon plus the first 60 bp of the intron containing the iSNV from individual genes (shown in orange), as well as universal plasmid exon (22 bp, red box) and intron (19 bp black line) homology segments for seamless insertion into the vector. RNA is transcribed in transfected cells from the 5′-UTR to the poly-A signal. PCR primers (red arrows) are used to amplify the RNA transcript. The assay produces spliced or unspliced transcripts (as well as other aberrant isoforms). Promoter, LTR RSV; SD, splice-donor site; SA, splice-acceptor site. b Summary of experimental results in three cell lines. Ref, reference allele; Alt, alternative allele. Blue color indicates an iSNV that induces a significant decrease in the spliced products (FDR ≤ 0.1); light blue indicates a decrease of spliced products that is not significant (FDR > 0.1). Red indicates a significant increase for spliced products whereas light red indicates an insignificant increase. Empty boxes are failed assays which were non-evaluable; iSNVs non-evaluable in all three cell lines (20 in total) were omitted. Validation rate (per cell line) is the percentage of assays showing a significant result in all evaluable assays. c Example of an iSNV-induced alteration of splicing outcome. The iSNV (rs6538694) suppressed the formation of the spliced reporter product, as consistently indicated in all three cell lines (p values ≤ 4.6 × 10⁻⁵). The y-axis is the log2 ratio of perfectly spliced reads (P) to aberrant (NP, non-perfect and unspliced) reads. p values were adjusted by FDR against all tested iSNVs. d Consistency of results in multiple cell lines. The x-axis is the log2 odds ratio of spliced and aberrant products (with respect to the reference and alternative alleles) for HeLa, and y- and z- axes are the log2 odds ratios for HepG2 and HEK293, respectively. Cell lines were compared pairwise for the iSNVs evaluable in both cell lines. Pearson’s correlations: HeLa versus HEK293 = 0.857 (blue dots, p value = 1.02 × 10⁻²²), HeLa versus HepG2 = 0.959 (red dots, p value = 6.66 × 10−40), and HEK293 versus HepG2 = 0.894 (green dots, p value = 6.65 × 10⁻²⁹). Solid lines in dark blue, red, and green mark the respective correlations

