Fig. 4.
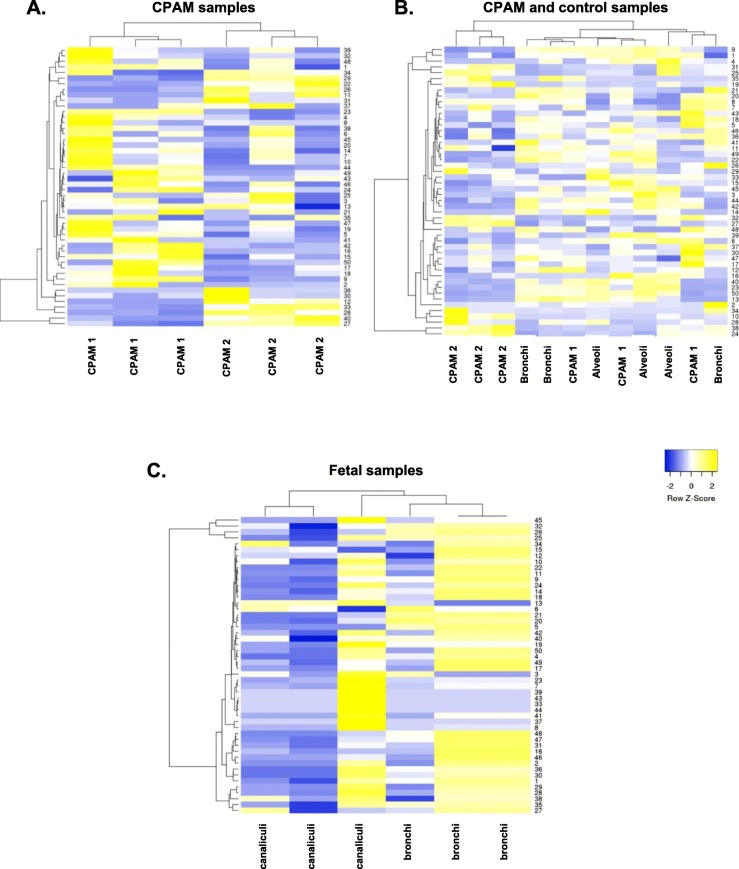
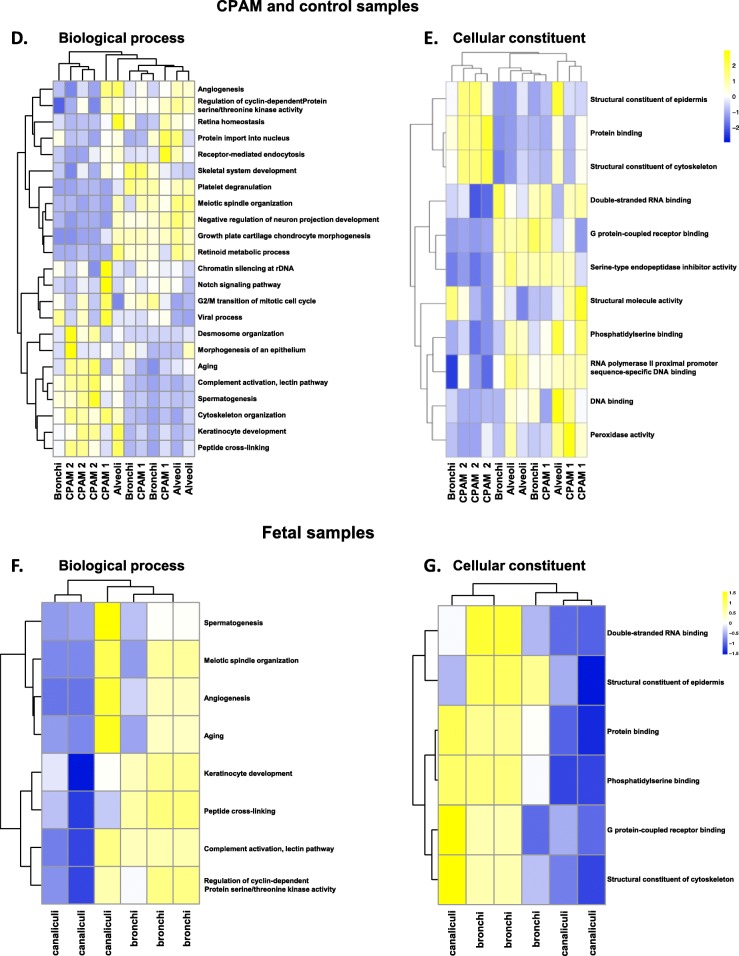
Protein profiles of CPAM cyst epithelium, bronchi, alveoli and fetal tissue. Proteins were obtained by microlaser dissection from 3 different patients. a-c Hierarchical clustering was based on the top 50 more abundant proteins. a. Comparison of proteomic profiles from the epithelial lining of CPAM 1 and CPAM 2 cysts, obtained by laser microdissection. Of note, CPAM 1 and CPAM 2 form two distinct clusters. b. Comparison of proteomic profiles from CPAM 1 or CPAM 2 cyst epithelium, and control lung tissues (bronchi and alveoli). CPAM 2 cluster together and CPAM 1 samples cluster close to bronchi and are more distant from the alveoli. c. Comparison of proteomic profiles from epithelial lining of fetal canaliculi and bronchi (16 GW). d-e Hierarchical clustering was based on the entire set of proteins detected. d. Protein-set enrichment analysis of biological process from the epithelial lining of CPAM 1 and CPAM 2 cysts, obtained by laser microdissection. e. Protein-set enrichment analysis of cellular constituent from the epithelial lining of CPAM 1 and CPAM 2 cysts, obtained by laser microdissection. f-g. Hierarchical clustering of fetal samples was based on a selection of candidate GO terms. f. Selected protein-set enrichment analysis of biological process from the epithelial lining from fetal canaliculi and bronchi (16 GW). g. Selected protein-set enrichment analysis of cellular constituent from the epithelial lining from fetal canaliculi and bronchi (16 GW).


