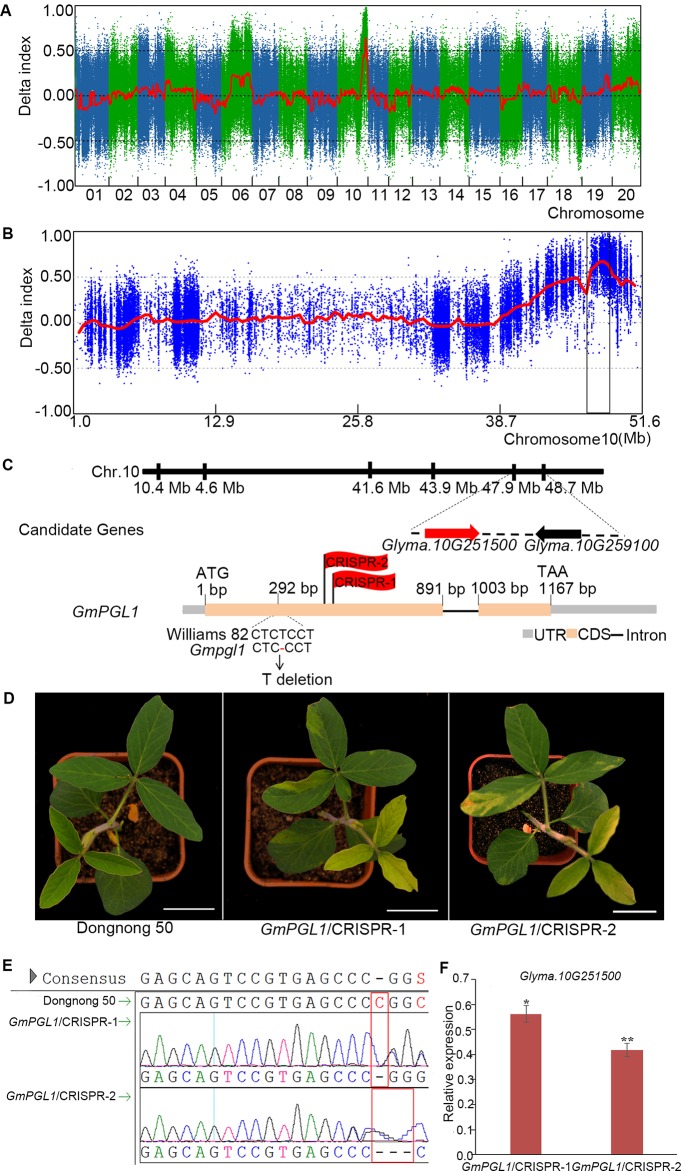
Figure 2.
Bulked segregant analysis (BSA) mapping of Gmpgl1. (A) SNP index plot on all chromosomes of F2. (B) SNP index plots on chromosomes 10 for Gmpgl1 mutant from F2 population. The interval between 46.90 - 48.90 Mb of chromosome 10 with a highest peak is the candidate region for Gmpgl1, in which the ΔSNP-index was greater than mean value (0.5). (C) The candidate gene GmPGL1 (Glyma.10G251500.1) is shown in the red arrow, the others in the black arrows. ATG and TAA are the start and stop codons, respectively. One thymidine nucleotide is deleted at 292 bp in the first exon of GmPGL1 gene. (D) Knockout of GmPGL1 in wild-type background phenocopied the Gmpgl1 mutant. Scale bars, 3 cm. (E) The sequences comparison of CRISPR plants and Dongnong 50 (WT) in the knock down regions. (F) The relative expression of GmPGL1 gene in CRISPR plants compared with Dongnong 50. Asterisks indicate a statistically significant difference determined by student's t-test (**P < 0.01, *P < 0.05) and the error bars represent standard deviations.

