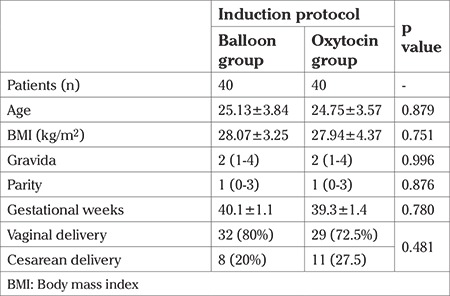
Table 1. Patient characteristics descriptive statistics were performed. The mean and median values are demonstrated. Standard deviation is marked with ± for the mean values. Minimum and maximum values were demonstrated for the median values with parenthesis.

