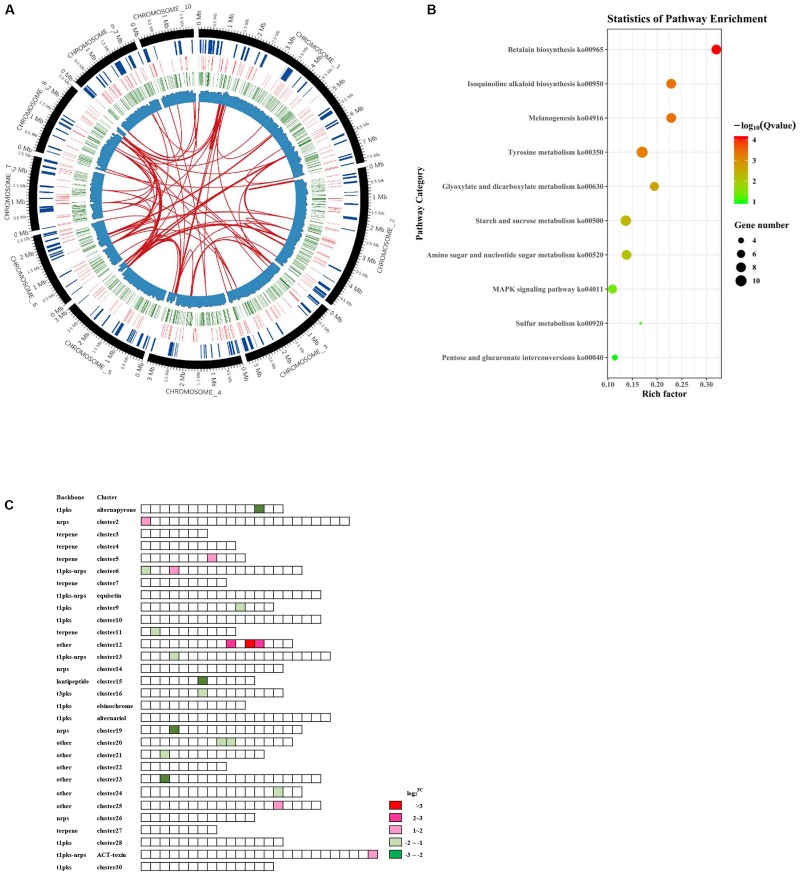
FIGURE 5.
Transcriptome analysis reveals the global regulatory functions of AaSte12 in A. alternata. (A) Circos plots showing DEGs in the Ste12 deficiency strain (ΔSte12) in relation to those of the wild-type strain (Z7). The circles, from periphery to the core, represent the chromosomes (excluding conditionally dispensable chromosome), the secondary metabolite gene clusters, the DEGs with upregulation in red and downregulation in green, and the GC content, respectively. Gene duplication is shown in the center. (B) Scatter plots of KEGG pathway enrichment based on statistic analysis of downregulated genes in ΔSte12. Rich Factor represents the ratio of the number of DEGs annotated in the pathway term in relation to the number of all genes annotated in the same pathway. Q-value was calculated from a corrected P-value; the lower value means the greater intensiveness. Top 10 pathway terms enriched are shown. (C) Differential expression of genes clusters associated with the biosynthesis of secondary metabolites between ΔSte12 and Z7. Abbreviations: pks, polyketide synthase; nrps, non-ribosomal peptide synthetase; t1, Type1; and t3, Type 3.

