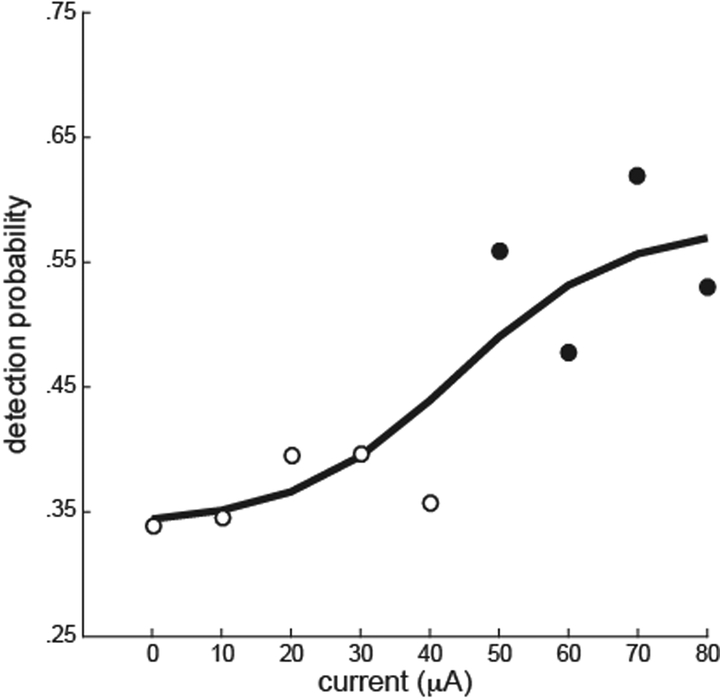
Figure 5.
Detection probability as a function of current amplitude. Pulse frequency was 100 Hz for all amplitudes. Data for 0 μA were from catch trials. Filled circles indicate the amplitudes in which the performance significantly differed from performance on catch trials (chi-squared tests, p < .05). A logistic function fit to the data is shown.

