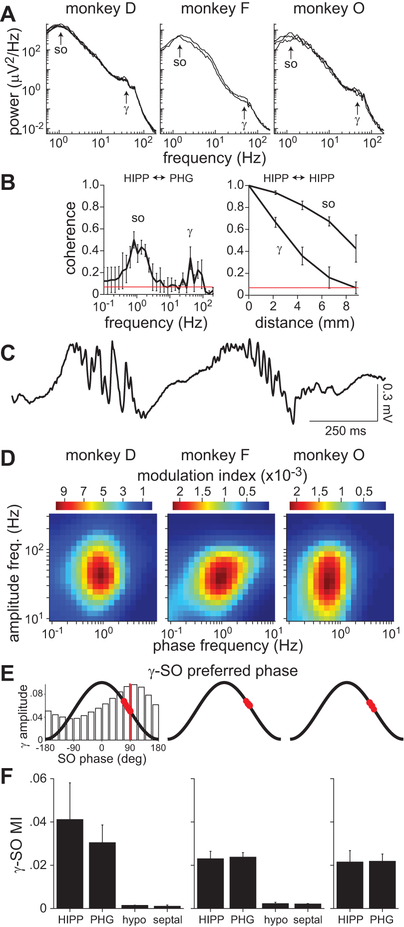
Figure 2.
Gamma-SO coupling during sedation. A, Power spectra of recordings from a HIPP electrode approximately 10–20 min after sedation. Spectra for multiple sedation sessions are shown (monkey D = 5 sessions, F = 2, O = 3). The same spectral features were seen on all other electrodes localized to the HIPP and PHG. B, Magnitude-squared coherence between HIPP and PHG activity (left) and between HIPP sites along the longitudinal axis (right). The mean coherence (± standard deviation, SD) across sessions is shown. Red line indicates coherence significance at the 95% level. C, Example segment of a HIPP recording from monkey D showing gamma bursts on the downslope of SO cycles. D, Comodulograms of HIPP activity in one sedated session for each monkey. The results were similar for all sessions. The color map indicates the modulation index, a measure of phase-amplitude coupling. E, Preferred SO (0.5–2 Hz) phase of gamma (30–80 Hz) oscillations. Red circles indicate the preferred phase for each HIPP and PHG electrode. The bar graph on the left is an example normalized gamma amplitude distribution from which preferred phases were computed. The vertical red line indicates the preferred phase for this distribution, which corresponds to the pixel with highest MI in the left comodulogram in D. F, Mean modulation index (± SD) between gamma amplitude and SO phase across electrodes grouped by anatomical location (HIPP, PHG, hypothalamus, septal nuclei). Note that monkey O (right) only had electrodes in the HIPP and PHG.

