Figure 6.
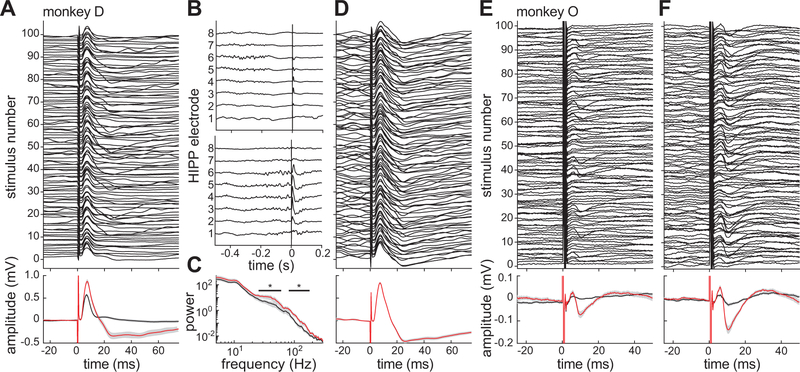
State-dependent PHG-HIPP connectivity during sedation. A, Peri-stimulus HIPP responses to 100 PHG stimulus pulses in monkey D (top). Note the presence of a large, biphasic EP after a minority of stimuli. At the bottom, mean responses are shown for trials with (red) and without (black) a biphasic EP as determined by cluster analysis. 95% confidence intervals on the mean are shown in gray. B, Example raw recordings from all 8 electrodes on the HIPP array during two of the PHG stimulus trials shown in A. C, Mean power spectra of activity in the 300-ms window preceding the stimuli for the large-EP (red) and small-EP (black) trial clusters. The black lines indicate frequencies at with the power significant differed between the two groups. D, Peri-stimulus responses as in A but for a closed-loop experiment in which PHG stimulus pulses were triggered by high 30–50 Hz power in the HIPP recording. E, Results of same open-loop stimulation experiment as in A but conducted in monkey O. F, Results of closed-loop stimulation experiment in monkey O using 70–100 Hz power to trigger the stimuli.

