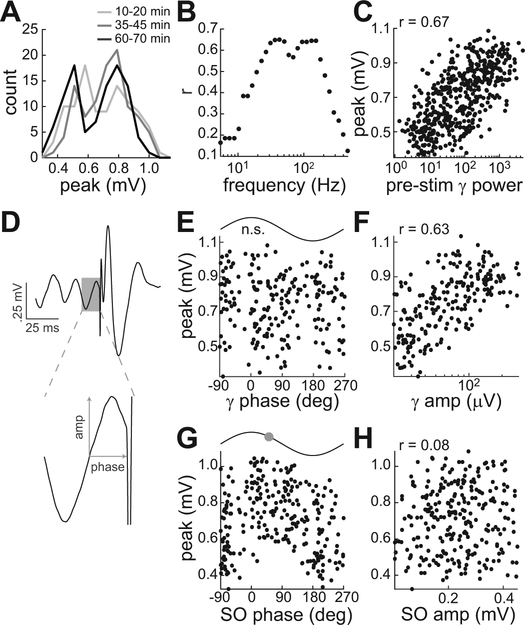
Figure 7.
Gamma and SO correlations with connectivity strength during sedation. Results are from a session with monkey D in which HIPP responses to 500 PHG stimuli were recorded. A, Bimodal distribution of peak EP values at the beginning, middle, and end of the session. B, Pearson’s correlation coefficient (r) between EP peak and pre-stimulus power as a function of the frequency band in which power was calculated. For all bands, power was calculated in a 300-ms window preceding the stimulus. C, EP peak versus power in the band with maximum correlation (39–46 Hz). D, Example measurement of amplitude and phase of the oscillatory cycle immediately preceding the stimulus. Pre-stimulus gamma cycles were isolated by highpass filtering at 25 Hz (210 of 500 cycles preceding stimuli were within the 30–100 Hz range). Pre-stimulus SO cycles were isolated by lowpass filtering at 3 Hz (263 of 500 within the 0.5–2 Hz range). The measurements were used to quantify the relationship between EP peak and gamma phase (E), gamma amplitude (F), SO phase (G), and SO amplitude (H). For phase relationships with significant unimodal tuning, the preferred phase is indicated by the circle on the sine wave above the plot.

