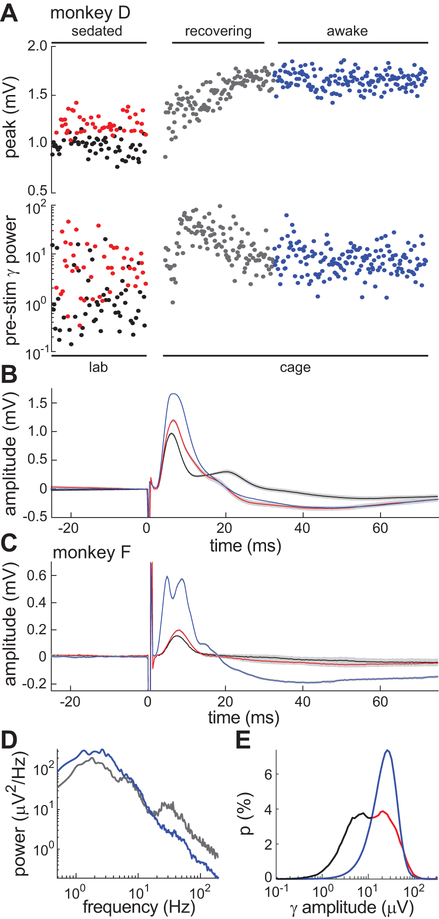
Figure 8.
Gamma-dependence of hippocampal EPs in sedated versus awake animals. A, Time course of EP peaks and pre-stimulus gamma power in monkey D across three behavioral states: sedated (red, black circles), recovery (gray circles), and awake (blue circles). Gamma (30–50 Hz) power was calculated in a 300-ms window preceding each stimulus. The horizontal axis is scaled to stimulus number not absolute time. PHG stimuli during sedation in the lab were delivered every 5 s by a commercial stimulator. PHG stimuli during recovery and awake periods in the home cage were delivered every 30 s by a custom wearable stimulator. Stimulus amplitude was 0.5 mA in both cases. The reversal agent, atipamezole, was given between the sedated and recovering states. B, Mean EPs during sedation (red, black) and awake (blue) for same dataset as A. 95% confidence intervals on the mean are shown in gray. C, Mean EPs for a sedated session (red and black) and awake session (blue) in monkey F. D, Power spectral density of the hippocampal recordings during recovery (gray) and awake (blue) states in monkey F. E, Distribution of gamma amplitude across sedated (red, black) and awake (blue) recording sessions in monkey F. The sedated distribution was colored black and red to highlight its bimodal nature and correspondence to the bimodal EP response amplitudes of A-C.

