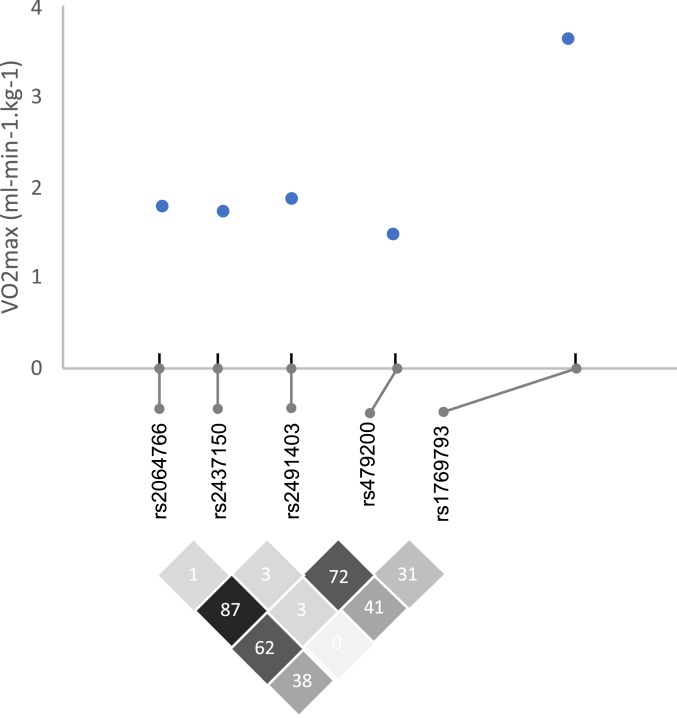
Fig. 2.
Difference in marginal mean values of VO2max (mL⋅min−1⋅kg−1) for the 5 significant SNP markers associated with VO2max. The difference in adjusted mean values of VO2max between the highest VO2max and lowest VO2max genotype categories for each SNP is plotted. The genomic coordinate of each SNP along chromosome 1 is shown along the x-axis. Linkage disequilibrium is shown via R2 values for each SNP by SNP comparison.

