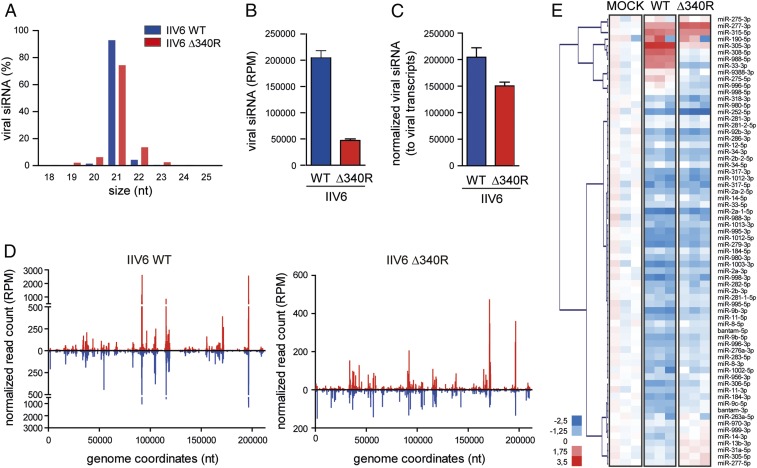
Fig. 2.
Small RNA profiles in WT and Δ340R IIV6 in Drosophila S2 cells. (A) Size profile of virus-derived small RNAs from IIV6 WT and Δ340R-infected S2 cells at 72 hpi. Viral small RNAs were mapped to the IIV6 genome, allowing 1 mismatch, and their size distribution as the percentage of total viral small RNAs is presented. Bars are mean ± SD of 3 independent libraries. (B) Number of viral 21-nt siRNAs presented as mean ± SD per million total reads (RPM). (C) Numbers of viral siRNAs normalized to library size and to relative viral transcript levels in the samples used for sequencing (averaged over 4 viral genes) (mean ± SD of 3 independent libraries). (D) Distribution of 21-nt vsiRNAs across the IIV6 genome, with vsiRNAs mapping to the R and L strands of the genome in red and blue, respectively. The average counts (3 experiments) of 5′ ends of small RNA reads at each nucleotide position are indicated. (E) Heatmap of the changes in miRNA abundance in IIV6 WT and 340R-infected S2 cells. Three libraries are presented separately. Hierarchical clustering is based on the averages of the 3 libraries. Color coding indicates log2-transformed fold-changes relative to mock infection.

