Fig. 2.
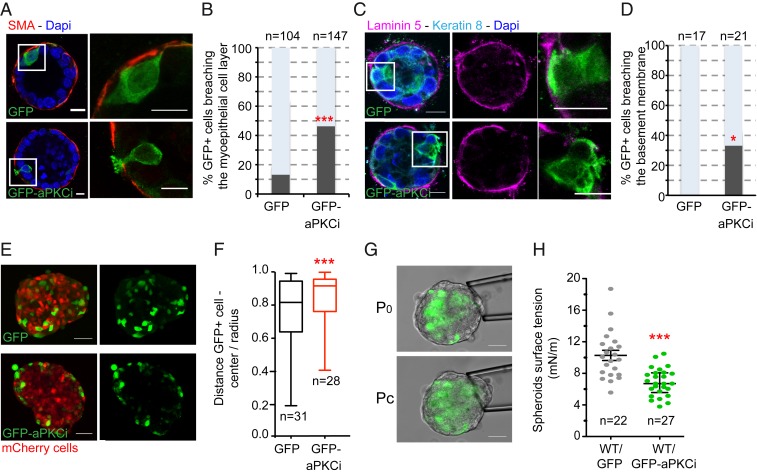
aPKCi overexpression triggers basal epithelial cell protrusions breaching the BM and cell segregation from the MCF10A WT cell counterparts. (A) Confocal images of mouse mammary organoids with a few epithelial cells overexpressing GFP or GFP-aPKCi. Myoepithelial cells were detected with anti-SMA antibodies (red). Nuclei were stained with DAPI (blue). (B) Quantification of the total number of GFP+ epithelial cells breaching the myoepithelial cell layer (***P < 0.001). Five independent experiments were performed. (C) Confocal images of mouse mammary organoids. Luminal cells and the BM are labeled with anti–cytokeratin-8 and anti–laminin-5 antibodies, respectively. (D) Quantification of the total number of GFP+ epithelial cells breaching the BM (*P < 0.05). Two independent experiments were performed. Quantification of all GFP+ cells was pooled from the independent experiments, and χ2 tests were performed for all data. (Scale bars, 10 µm.) n, number of cells. (E) Confocal images of MCF-10A spheroids mixed with GFP+ or GFP-aPKCi+ cells and mCherrry+ cells. (Scale bars, 50 µm.) (F) Quantification of GFP+ cell distribution. The graph shows the ratio between the distance of GFP+ cells from the center of the spheroid and the radius of the spheroid (from 3 independent experiments). n, number of spheroids. A Mann–Whitney test was performed (***P < 0.001). (G) Images of micropipette aspiration of MCF-10A spheroids at the resting pressure P0 (Top) and at the critical pressure Pc, for which the deformation of the spheroid reaches the micropipette radius (Bottom). (Scale bars, 50 µm.) (H) Individual (dots) and mean ± SEM (bars) surface tension measurements on spheroids containing a mix of WT and GFP+ or GFP-aPKCi+ cells. A Student t test was performed (***P < 0.001). Three independent experiments were performed. n, number of spheroids.

