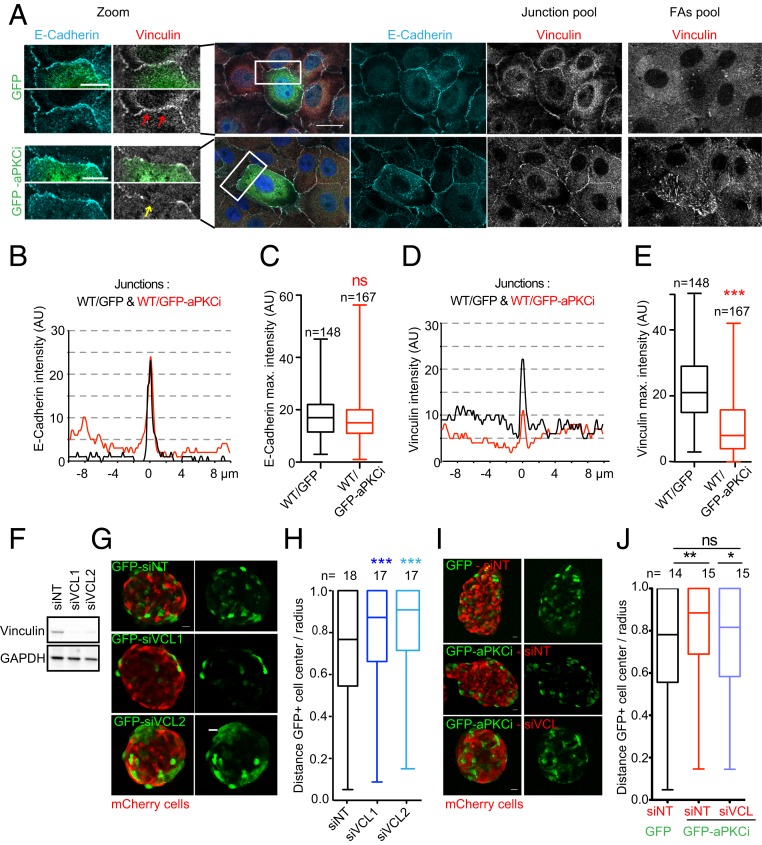
Fig. 3.
A decrease of vinculin at junctions between WT and aPKCi+ cells triggers the segregation of aPKCi+ cells from normal cells. (A) Images of a monolayer of MCF-10A WT cells mixed with MCF-10A GFP or GFP-aPKCi cells on glass stained for nuclei (DAPI in blue), E-cadherin (cyan), and vinculin (red or gray). The z plane of focal adhesions (FAs) is 0.9 µm from the z plane of the junction (E-cadherin plane). (Scale bars, 20 µm and 10 µm for the zoom.) (B) Representative line scans of E-cadherin fluorescence intensity, in arbitrary units (AU), at the interface between a WT cell and a GFP+ cell (black line) and between a WT cell and a GFP-aPKCi+ cell (red line). (C) Quantification of the maximum intensity of E-cadherin staining at the interface between MCF-10A WT and GFP+ cells or between MCF-10A WT and GFP-aPKCi+ cells. A Mann–Whitney test was performed (ns, not significant). n, number of junctions. (D) Representative line scan of vinculin fluorescence intensity, in arbitrary units (AU), at the interface between a WT cell and a GFP+ cell (black line) and between a WT cell and a GFP-aPKCi+ cell (red line). (E) Quantification of the maximum intensity of vinculin staining at the interface between WT and GFP+ cells or between MCF-10A WT and GFP-aPKCi+ cells. A Mann–Whitney test was performed (***P < 0.001). n, number of boundaries. (F) Expression levels of vinculin in MCF-10A GFP cells treated with siNT, or 2 independent siVinculins (siVCLs). (G) Mixed spheroids of MCF-10A mCherry cells and MCF-10A GFP treated with the indicated siRNA. (H) Quantification of cell segregation between mCherry and GFP+ cells from 3 independent experiments. A Kruskal–Wallis test was performed (***P < 0.001). (I) Spheroids of MCF-10A mCherry cells treated with the indicated siRNA were mixed with MCF-10A GFP+ or GFP-aPKCi+ cells. (J) Quantification of GFP+ cell distribution. The graph represents the ratio between the distances of GFP+ cells from the center of the spheroid and the radius of the spheroid in 3 independent experiments. The Mann–Whitney test was performed (*P < 0.05, **P < 0.01; ns, not significant). n, number of spheroids. (Scale bars, 20 µm.)

