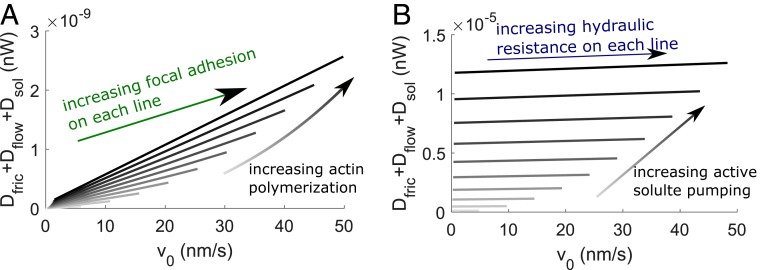
Fig. 2.
Mechanical-energy dissipation during actin- and water-driven cell migration from the 1D model. (A) Total mechanical energy dissipated as a function of for different and rates of actin polymerization. The velocity field is extracted from Fig. 1C. Darker lines represent higher rates of actin polymerization. (B) Total mechanical energy dissipated as a function of for different and rates of active solute pumping. The velocity field is extracted from Fig. 1E. Darker lines represent higher rates of active solute pumping.

