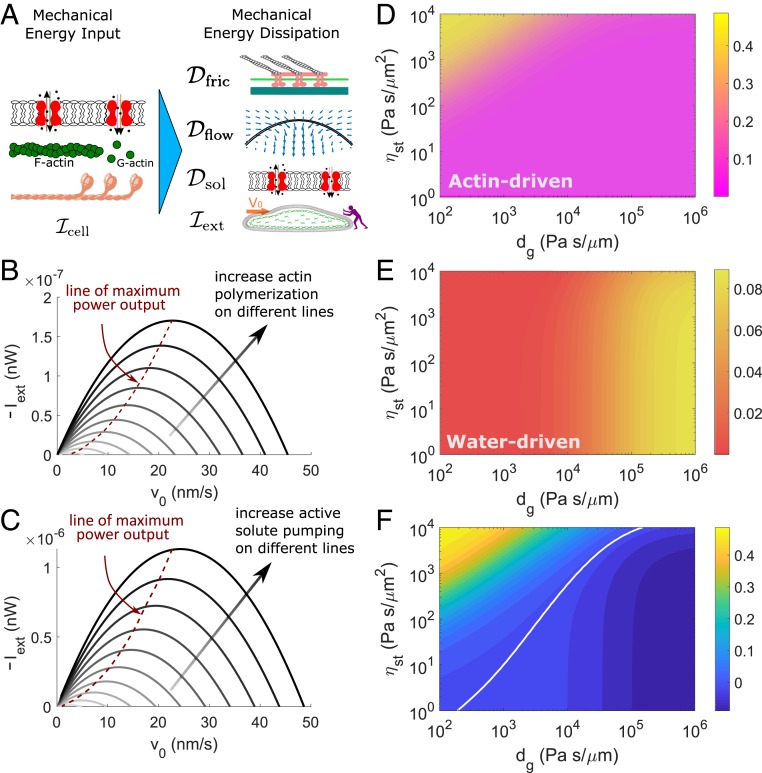
Fig. 3.
Mechanical-power output and efficiency predicted from the 1D model. (A) When the external force works against cell migration, we can take the minus of as a power output. (B and C) Power–velocity relation. Within each line, increases from right to left. In B, darker lines represent higher rates of actin polymerization. Pas/. In C, darker lines represent higher rates of active solute pumping. Pas/m. (D–F) Contours of the mechanical-output efficiency of migration defined by . (D) Output efficiency of actin-driven cell migration . (E) Output efficiency of water-driven cell migration . (F) The difference of efficiency of the 2 mechanisms of migrations, . The white line is the cross-over line showing .

