Fig. 3.
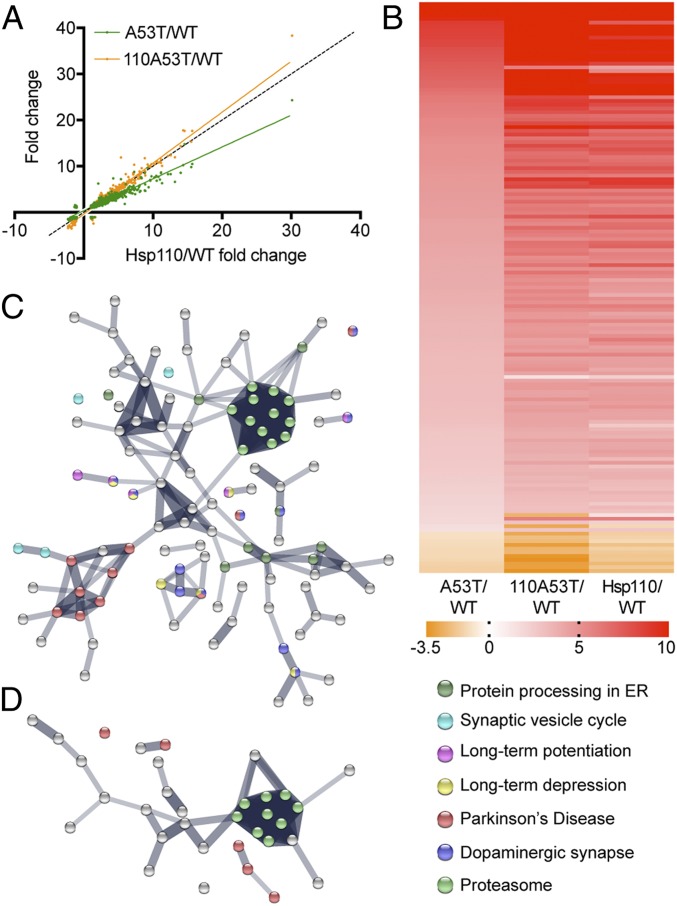
Proteomic analysis of 110A53T, A53T, and Hsp110 brains. (A) Synaptic protein expression levels in 110A53T were plotted against those in A53T and Hsp110 after normalization to WT. Confidence interval for slope of the line for A53T = 0.606 ± 0.006 while slope of the line for Hsp110 = 0.844 ± 0.00611. Dotted line indicates x = y. (B) Heatmap of protein expression changes in A53T, Hsp110, and 110A53T as compared to WT. The expression levels of 142 proteins with a >1-fold change difference in A53T/WT versus 110A53T/WT are shown here in order of decreasing A53T/WT ratio. Red indicates a 10-fold change or greater, orange indicates a −3.5-fold change or less, and white indicates no change. (C) STRING analysis of differences between A53T and 110A53T. (D) STRING analysis of differences between Hsp110 and 110A53T. n = 3 biological, 3 technical replicates. Mice were 6 mo old.

